Welcome to our weekly newsletter where we provide an overview of the main US and UK indices, along with analyses of selected assets that are outperforming the market.
Let’s get into this week’s newsletter!
US & UK INDICES OVERVIEW
This week has been pivotal for US equity markets with the three main indices – S&P 500, Nasdaq and Dow Jones – creating all-time highs. A confluence of breakouts of these indices gives us confidence the momentum we have seen since November will continue in 2024.
The S&P 500 closed the week at 4840, a gain of 1.2%. January is proving to be another strong month with a gain to date of 1.5%. The index has gained 17% since the pullback in October and a gain of 38% since the October 2022 lows.
The bulls remain in control of the equity markets which aligns with our long term position.
We continue to see individual stocks perform well. Our portfolio currently compromises over 20 US stocks. We have compounded a number of these assets, in turn, delivering excellent profit for our Phoenix community members.
The FTSE 100, the UK’s premier index, closed the week with a decline of 2.1%, to close below the weekly 50 SMA. Price remains range bound between 7200 and 7750. Should strength return, the next major area of potential resistance is the pivot high from 17 April at 7936. The all-time high is 8047. We continue to monitor this index, waiting for confirmation of direction.
PERFORMANCE REVIEW
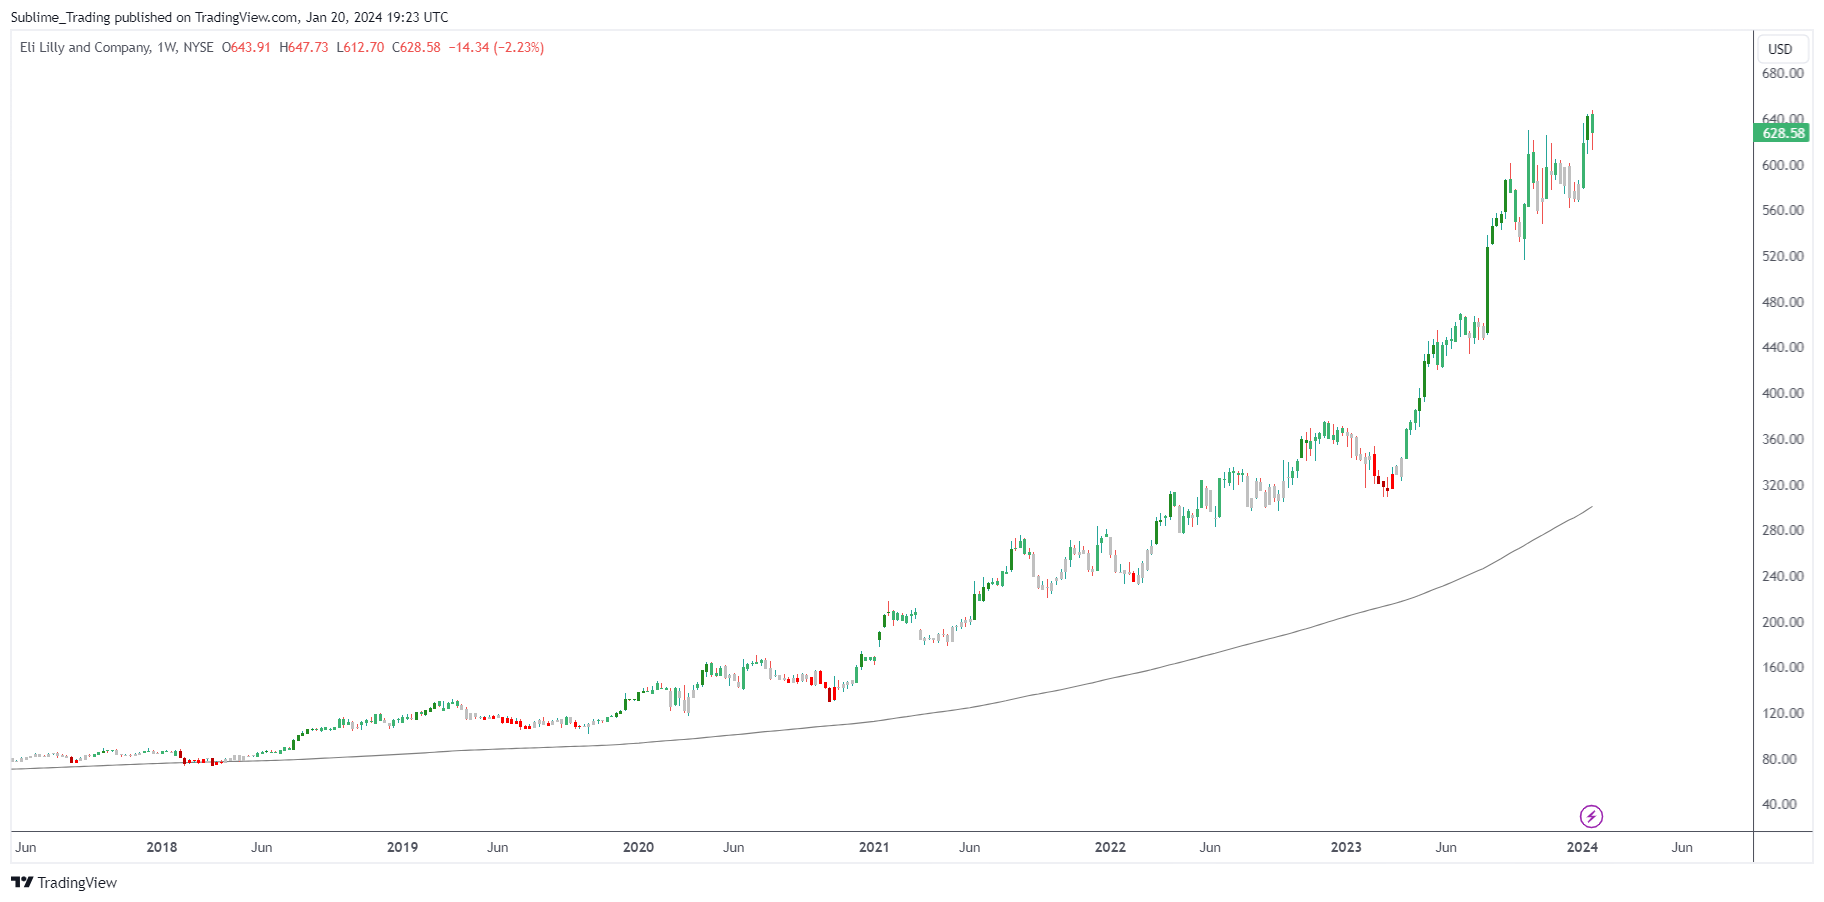
Eli Lilly and Company - LLY
Eli Lilly and Company (ticker: LLY) is a pharmaceutical company that develops and produces medication for various diseases and conditions. Its products are sold in approximately 125 countries. The company was founded in 1876 and is best known for its clinical depression drug Prozac. Lilly’s achievements include being the first company to mass-produce the polio vaccine and insulin.
Our breakout strategy identified LLY as a high probability candidate in May after the stock closed above last year’s high and the $400 round number. Since then price has been extremely bullish, gaining 59%. Our strategy has capitalised on this trend by compounding multiple times, whilst maintaining a 2% portfolio risk. Looking ahead, we can expect the trend to continue, with the moving averages aligned on both the weekly and daily timeframes, and price making a series of higher highs and higher lows. The next area of potential resistance is the $700 round number.
The total performance to date is a 1,323% Return On Investment and 26% Return On Capital, applying a full portfolio risk of 2%.
LLY is an excellent example of how a stock can form a bullish trend following a breakout from a key resistance level. The total amount of time required to set up and manage this trade has been less than 5 hours over 9 months – this is the benefit of trend trading; using higher time frames such as monthly and weekly charts to avoid the noise and stress of shorter time frames. This approach enables busy professionals the freedom to pursue other interests and avoid hours each day in front of a trading screen.
OUTPERFORMING ASSET FOR THE WATCHLIST
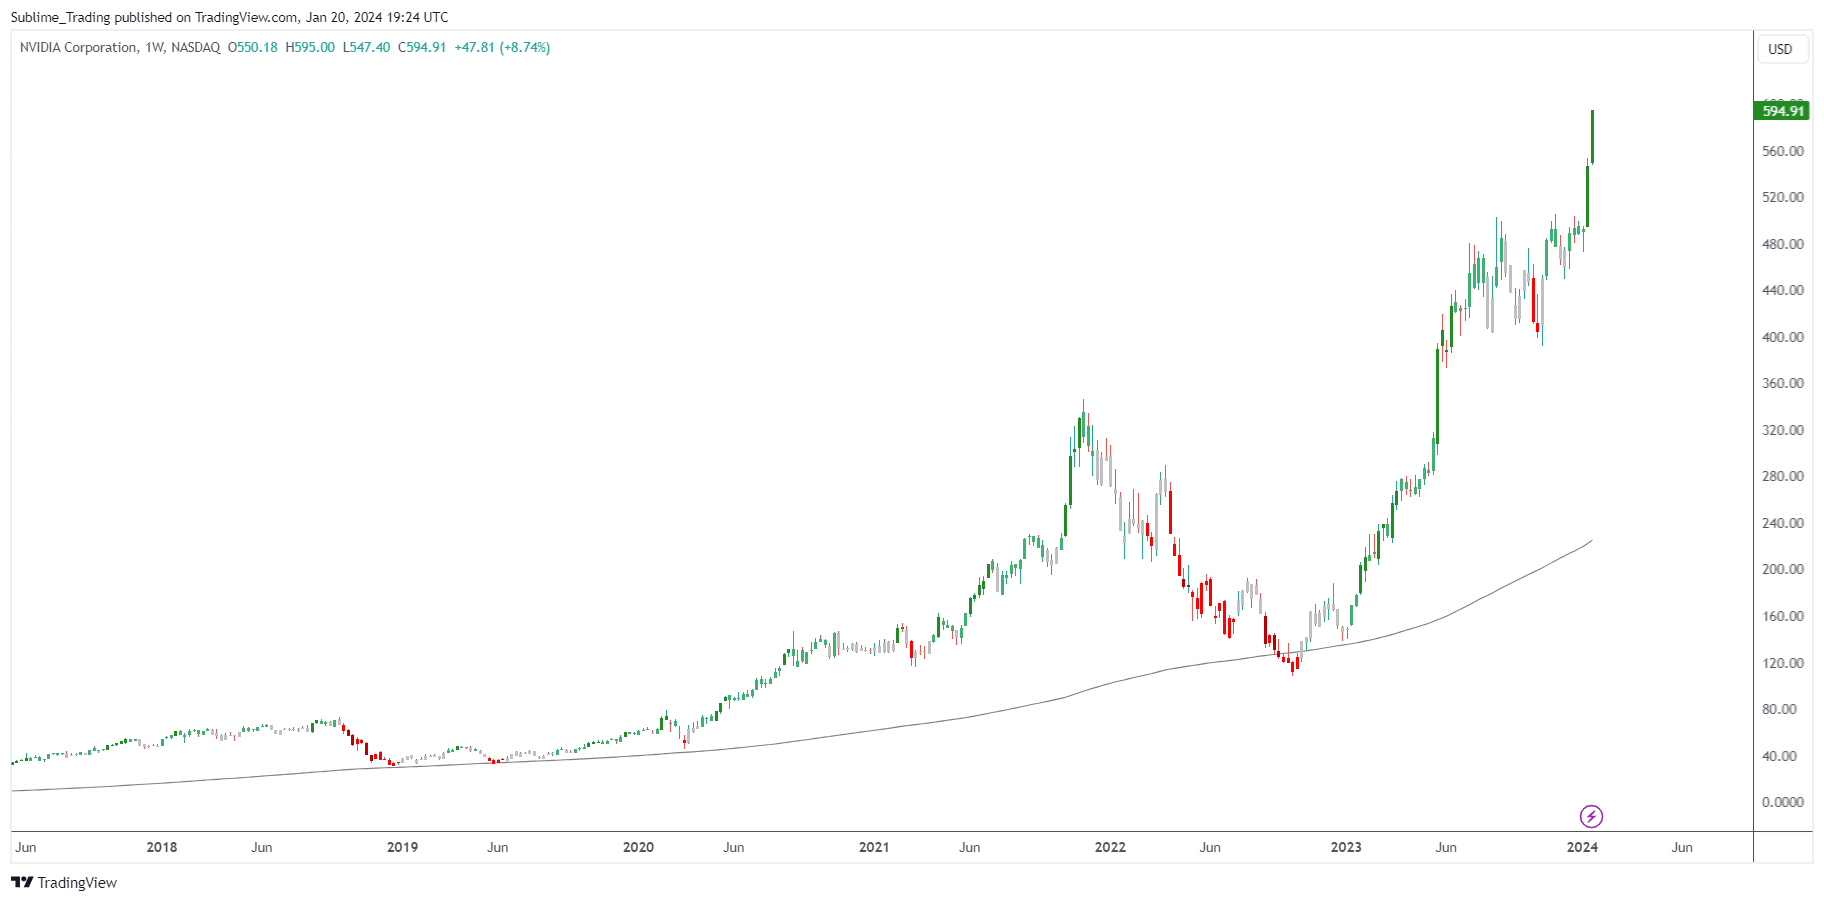
Nvidia Corporation - NVDA
Nvidia Corporation (ticker: NVDA) is an American multinational technology company. It is a software company which designs graphics processing units (GPUs), application programming interface (APIs) for data science and high-performance computing as well as system on a chip units (SoCs) for the mobile computing and automotive market. Nvidia is also a dominant supplier of artificial intelligence hardware and software. In a world increasingly reliant on technology, the chances are that the technology you are using is being powered by an NVDA GPU!
NVDA has established a track record of long-term trends, spanning various periods including 2016-2018, 2020-2021, and more recently since October. These trends have resulted in significant price gains of 388%, 327%, and 307% respectively. Consequently, NVDA’s consistent performance in long-term trends instil confidence for long term investors, such as ourselves, in its future potential.
Closing the week at $595, strength continues with the bulls firmly in control. Following a period of consolidation between July and December, price has again broken out and price is displaying bullish momentum. In January, to date, price has gained over 20%.
On the weekly time frame, NVDA continues to trade above both the 50 and 200 SMAs. Our proprietary tool, the Sublime trend filter, remains green, indicating positive market sentiment. Whilst on the daily time frame, the Sublime trend filter is also green. The price remains above the 20, 50, and 200 SMAs.
Looking ahead, the next area of potential resistance is the $600 round number. Should NVDA exhibit a continuation pattern above the all-time high, it could present an opportunity for our Phoenix community members, who have profited handsomely from this stock in the past.
Looking Ahead
As we set out last week, the bulls remain in control of the US equity markets. We have a large number of positions which are profiting from this momentum. As always, we will let price dictate our next move.
At Sublime, our unwavering commitment lies in conducting thorough analysis based on objective data and factual evidence presented in the charts. By adopting this approach, we aim to provide valuable guidance to our esteemed Phoenix community, collectively exploring opportunities that hold the potential for long-term, profitable trades.
Keep it simple. Keep it Sublime.
The ST Team
P.S. Answer 21 rapid-fire questions about your investing approach and then as if by magic, we will give you recommendations that are right for you and you’ll unlock your FREE Bonuses that will improve your investing results over the next 3 to 5 years.


