
Learn to buy stocks in 5 simple steps with helpful tips and examples to get you off to the best start possible on your investing journey.
Warren Buffett has amassed a fortune of over $80 billion buying shares and it’s time you got yourself a piece of the cake. Your intentions are clearly good and investing in stocks is an opportunity open to us all that must be taken but getting started is often like going down a rabbit hole. But not anymore…
The simplicity of finding profitable stocks
When first getting started, questions that will come to the newbie investor’s mind are:
-
Where do I get started?
-
How much do I need to get started?
-
What stocks shall I invest in?
-
How do I know when to enter?
-
How much should I risk?
-
How do I know when to exit?
-
Do I need to read the news?
-
What broker should I use?
-
Whose opinion should I listen to?
The list of questions may seem endless and even daunting. The internet is, of course, a great place to start with your research but it can lead to a case of analysis paralysis for those with a more cautious disposition as you flick from one page to another.
The more gung-ho will find themselves impulsively opening and funding broker accounts as the over-hyped promises of quick-riches through day trading plastered all over the internet become that tad bit too alluring.
The correct approach lies somewhere in the middle. Do your research, know what tools and techniques you need for the job, know what time and money you need to invest and play the long game, just like any successful business.
Ultimately, the goal is to make consistent growth as safely and as efficiently as possible. The best approach is simple but it certainly won’t be easy as you learn to deal with the ebb and flow of the market and why should it be easy?
The best things in life you have to apply yourself to and earn the rewards. However, investing in good stocks certainly is not as difficult as it is often made out to be.
It just comes down to knowledge, awareness and familiarisation and so to cut through all the clutter plastered on the internet and get straight to what works, here is how to buy the best stocks in 5 simple steps.
Step 1: Learn to read the charts
Chart-reading live prices is synonymous with trading stocks whereas investing in stocks is synonymous with reading about the company. Both methods are ultimately a means to an end which is to understand the long-term potential of making money from a stock. Both have their merits and their challenges but chart-reading for private traders and investors is far more straightforward and powerful and here is why:
It’s simpler
With charts, you are dealing with prices only and can visually see the history of the stock and if the stock is going up, down or sideways. It takes a lot of guesswork out of what the stock is doing right now and how far price has the potential to move.
“Technical analysis” is the term used to look at the history of the chart to determine patterns that are likely to repeat in the future.
It is a simple and very fruitful art to learn. Being able to identify and then capture the emergence of repeating patterns is how money is continuously made.

There is no dealing with complicated reports, terminology and formulas as well as all the news coming out throughout the day every day which all comes under the banner of “fundamental analysis”.
Let’s be real, if you could avoid having to rummage through tons of company paperwork and crunching through tons of data and make the same amount or even more profit just looking at the charts, wouldn’t you prefer not to?
Note: Institutions are privy to getting news items early as they pay £1000s on a monthly basis for specific news terminals. They have whole floors of analysts to go through the data and so by the time we, the private investor have heard the news, it has already been traded on and factored into the market. Focusing on charts and prices as private investors is our edge and just makes sense as opposed to trying to keep up with the “big dogs”.
A little known secret is as the news is already factored into price, we can indirectly invest with the big institutions that invest using news terminals just by learning how to identify repeatable patterns that appear in the charts.
It’s less time consuming
Chart reading allows you the flexibility to see live prices coming through on a multitude of timeframes even down to seconds. Now where many investors go wrong is looking at these “intraday” timeframes to try and catch quick moves in the market and in turn win big quickly. This approach comes under the banner of “day trading” and is, in fact, a classic approach to going bust quickly.
It is sold as the sexy way to quick riches, thinking money can be made every day, but the only people that profit long-term from this approach are those selling those promises through overpriced day trading courses and automated trading systems that have been backtested and curve-fitted for best results.
Thinking money can be made everyday is an “employee mindset” where you swap time in front of the computer screen for money and just does not fair well with how the markets move.
What you need is an investor mindset where you understand investments are placed and money is made only in trending periods, periods which can last several months.
Then you take your profit and stand aside when trends end and markets move sideways which can also be for months at a time.
What you may not be aware of is that the profit accumulated in trending markets and through compounding, which we cover in more detail a little later on, is life-changing and will totally remould your understanding of making money.
In addition, having the time to even look at intraday timeframes is a real challenge. You will no doubt have a career or a business to run, you may be in a relationship, possibly married with children, have a social life and hobbies, in other words, a lifestyle and so time is short.

Trying to trade intraday charts or keep up-to-date with reports and news items if you take the fundamental and investor approach will soon be a hindrance to progress and it is in fact very unnecessary.
By looking at a stock purchase on the higher time frames – the daily, weekly and monthly – we bring the perfect blend of the investor mindset of thinking long-term to the trader approach of using charts and technical analysis.
We focus on end-of-day prices as a minimum, the intraday noise is of absolutely no concern to us. We then only need to spend a few minutes each day at the end of the day to make any investing decisions.
It’s an all-conquering approach for the private investor that adapts perfectly around the busiest of lifestyles without compromising on time and profit.
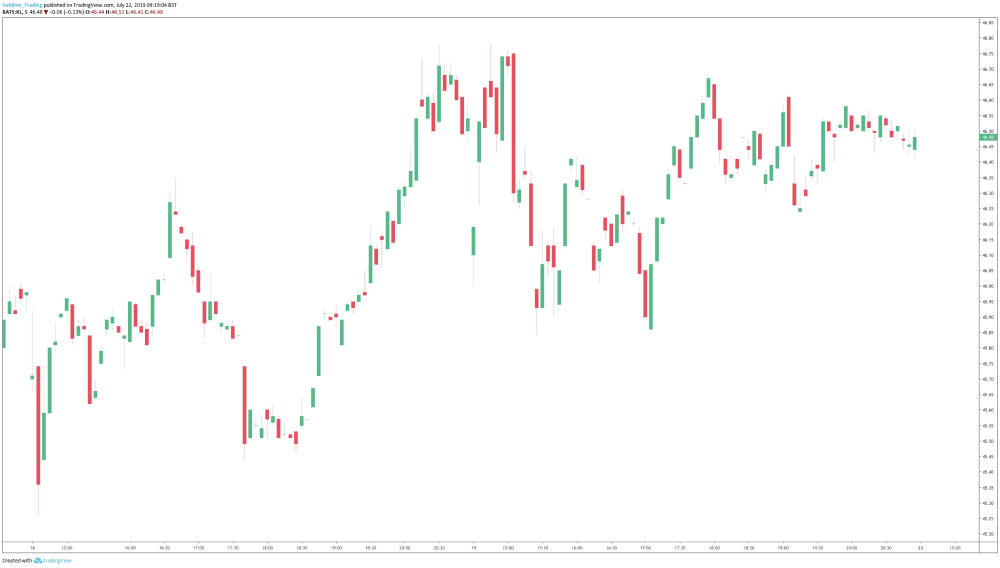
A Messy 5-minute chart of stock – Kirkland Lake Gold
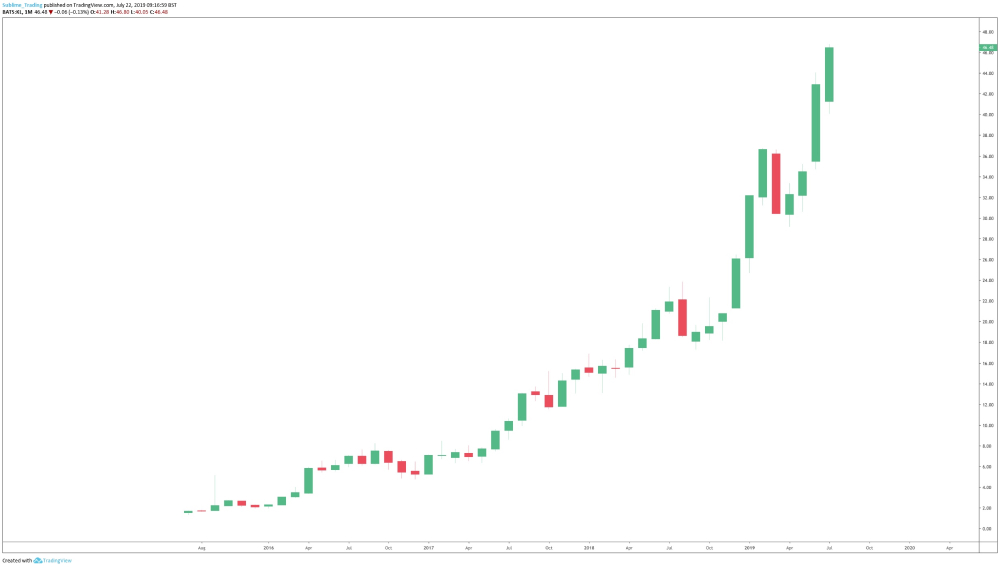
Clean-looking monthly chart of stock – Kirkland Lake Gold
It’s easier to identify trending stocks on the higher time-frames. Markets either move up, down or sideways. The two most profitable environments are either when a stock is going up which is a bull trend
or when the stock is going down which is a bear trend.
When the stock is going up and making higher highs, you buy or go long to make money. When the stock is going down and making lower lows, you sell or go short to make money. When a stock is going sideways, it is in consolidation and you stand aside and look for another stock that is moving up or down in a trend.
Tip: Shorting a market is often a foreign concept and is where investing has an edge over traditional investing. Traditional investing involves buying stocks and waiting for them to go up to see a return on your investment. This can mean being saddled with poorly performing stocks that may never go up and then being lumbered with stocks you cannot get rid of. With investing and using a good online broker account, which we will cover in more detail in Step 5, means having the opportunity to make money by buying stocks in a bull market and by also selling stocks in a bear market.
Tip: Sometimes the whole stock market may be going sideways in which case good investors will leave stocks altogether and move to forex or commodities or even cryptocurrencies, one of which is likely to be trending. Money is moved from market to market and so by being able to recognise which market is in trend, you recognise where the money is and then build a portfolio around the best looking trending instruments in that market. You hold onto those positions until they reverse or go into consolidation and the money leaves to another market and repeat the process and round and round you go. This process of identifying which market the money is flowing to is the bedrock of good investing which we will expand on in Step 2.
It’s simple. It’s repetitive but it’s very lucrative when done correctly.
Now, one of the questions I am often asked is how long will an instrument trend for? The honest answer is I have no idea, no one does, even Warren Buffett has no idea and we don’t need to know either. However, based on the history of the stock, you can build a possible picture of what the future holds. Of course, there is no guarantee and that is where good risk management and exit management come in which we will talk about in more detail in Step 4.
First, let’s define a trend by looking at fashion as an example. The minimum time we expect any item of clothing that we purchase to stay in fashion for is 3 months as fashion ranges are seasonal.

But it is not uncommon to define fashion trends over a much longer period such as a decade, for example, the ’60s, the ’70s, the ’80s and so on. We are not talking months but years.
Fashion trends that come and go and that are quickly forgotten about or laughed at are defined as fads. The reason I mention this is that day traders will try and capture “trends” on the lower timeframes which last seconds to minutes to hours to maybe a few days which often requires a large risk associated to it and a lot of screen time. It is a lot of work for very little reward and why day traders struggle so miserably to ever grow an account.
By using the daily, weekly and monthly timeframes, you put yourself in the very smart position to catch the much larger and far more profitable trends in the market with little effort and minimum risk. It is not uncommon to see stocks trending for 12 months to 24 months before moving into consolidation. In forex, it is not uncommon to see trends last a year and commodities much much longer.
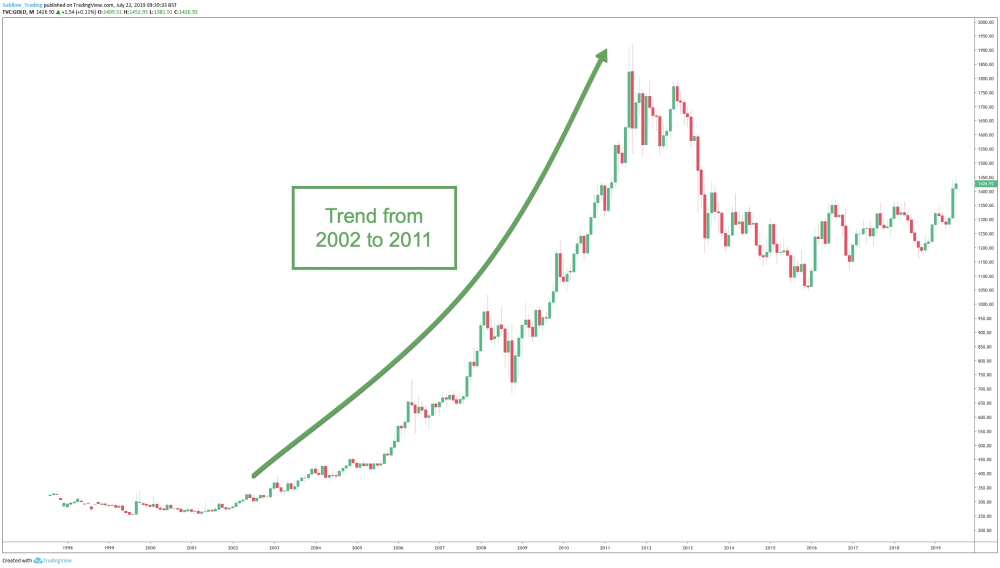
Gold, for example, trended from 2002 to 2011 before consolidating from 2013 until today. Gold is one to keep an eye out on now as price is finally showing signs of breaking out of consolidation and moving into trend.
Gold in a bullish trend from 2002 to 2011
Trend following using charts and the higher time-frames coupled with the all-important long-term investor mindset easily and effortlessly trumps a day trading approach as well as using fundamentals to make investment decisions.
Step 2: Invest in good scanning software
A good scanning software will help to make finding stocks a whole lot easier.
As mentioned above, being able to identify how to follow the money is the bedrock of good investing and to do that requires investing in scanning software. There are a lot of choices out there, some free and some cheap but remember, you get what you pay for. Good scanners do not have to be ridiculously expensive but they are essential and without a shadow of a doubt will reward you in the long run and here is why:
They save you a lot of time.
There are over 10,000 stocks in the US stock market. Throw in UK stocks, forex, commodities and cryptocurrencies and you have a huge list to sift through to look for the handful of instruments worth investing in. To do this manually on a daily basis is a near impossible task but with a good scanner programmed to search for a particular criteria will cover over 10,000 stocks in minutes at a click of a button.
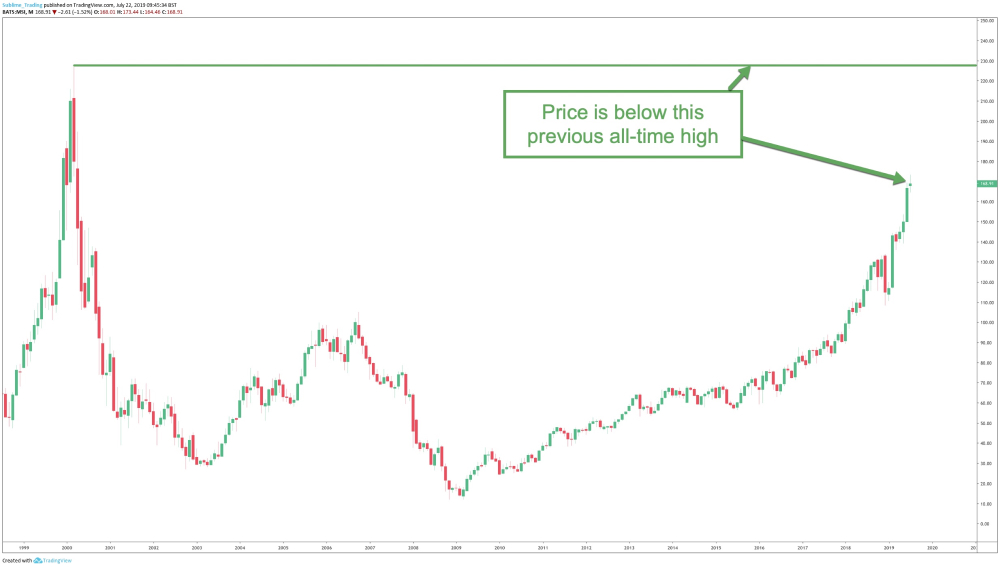
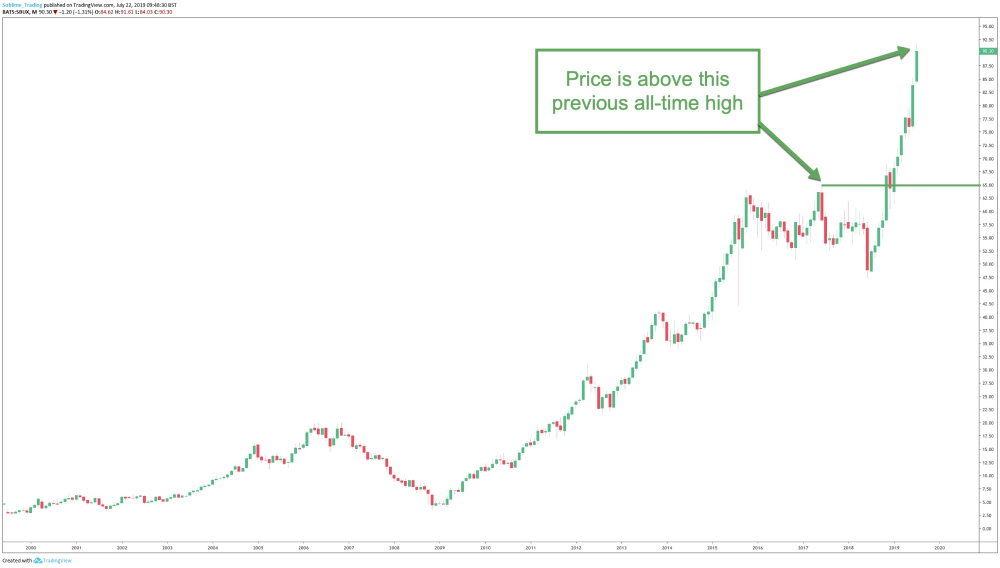
Criteria that we use our scanners to search for include stocks creating new all-time highs and stocks with volume over 1 million. The benefit of investing in stocks creating new all-time highs is because price has the ability to keep rising resulting in more effortless profit accumulating in our accounts As price is below the previous all-time high, it could limit the uptrend.
The short-list created by the scanner is a far more manageable list that we then go through manually using the charts and our bespoke trading and investing tools. To pick out the best of the best stocks requires a combination of software to create the shortlist and human discretion using Sublime’s TradingView tools to look at the history of the charts on the shortlist. We can then determine which stocks have the best potential to return long-term profit.
This combination of scanners and our bespoke investing tools means what would be a near-impossible task takes no more than an hour, maybe 2, to have the very best stocks at our fingertips. We do this every weekend without fail to prepare for the week ahead.
From Monday to Friday and at the end of each trading day, we then just need to enter investments when they set up and manage investments that may already be open which takes minutes a day. It is why this style of investing adapts easily around the busiest of lifestyles.
Here at Sublime, we save our community members £1000s in subscription costs and hours and hours of time looking for stocks by doing this whole process for them.
We have been subscribing to scanners for years and continue to use the same process today for our own portfolios and so our members don’t have to repeat the process themselves, saving them hours of time which can be spent on more enjoyable pursuits as well as significant money which can be added to their investing account.
We put the shortlist of the best-looking UK and US stocks, forex and commodities in bi-weekly videos, at the weekend and midweek, and share them in our private community.
Click here to subscribe to our weekly newsletter to get access to this shortlist for yourself.
They remove opinions
“Trade what you see and not what you think” is a well-known expression in the investing world although very poorly practised. In short, it means to ignore all opinions including your own and to focus on price itself.
Historically speaking, analysts have a reputation for being wrong and so turning to analysts for advice and approval on your trading and investing decisions will be detrimental to your long-term success.
We will be looking at the S&P 500, which is an Index that guides us to see the overall market direction, in more detail in the next step.
Having good scanners and being able to sift through the results of the scan with good investing tools will totally remove the need for opinions and eliminate subjectivity and confusion as the truth lies in the charts and what price is suggesting.

Good investors let price dictate what action to take, bad investors try and predict based on their opinions and the opinions of others’.
In addition, removing opinions will save you hours and hours of time watching news channels, reading reports and conversing with the wrong people in forums that will simply have no long-term benefit for your investments. In fact, adopting the correct set up will free up hours of your time to spend it doing things you enjoy and with your hard-earned money working for you in the background which is ultimately what life is about.
Step 3: Let the S&P 500 guide you
There is simply no better way to know when to invest and when not to invest than using the S&P 500 as your barometer for market conditions. In flashy terminology, the S&P 500 is a market-capitalisation-weighted index of the 500 largest U.S. publicly traded companies and is regarded as the best gauge of large-cap U.S equities.
In simple terms, think of the S&P 500 as a chart that represents the average of the 500 largest U.S publicly traded companies but they are not equally weighted. The larger the market-capitalisation of the stock, the more weight it has on the average. So real “big dog” stocks can create a far bigger move on the S&P 500 than their smaller counterparts.
However, stocks tend to move in unison, so in a bull market most stocks will move up together, in a bear market most stocks will move down together and in a sideways market most stocks will move sideways together and there is no better representation of this than using the S&P 500 to guide you in overall market conditions.
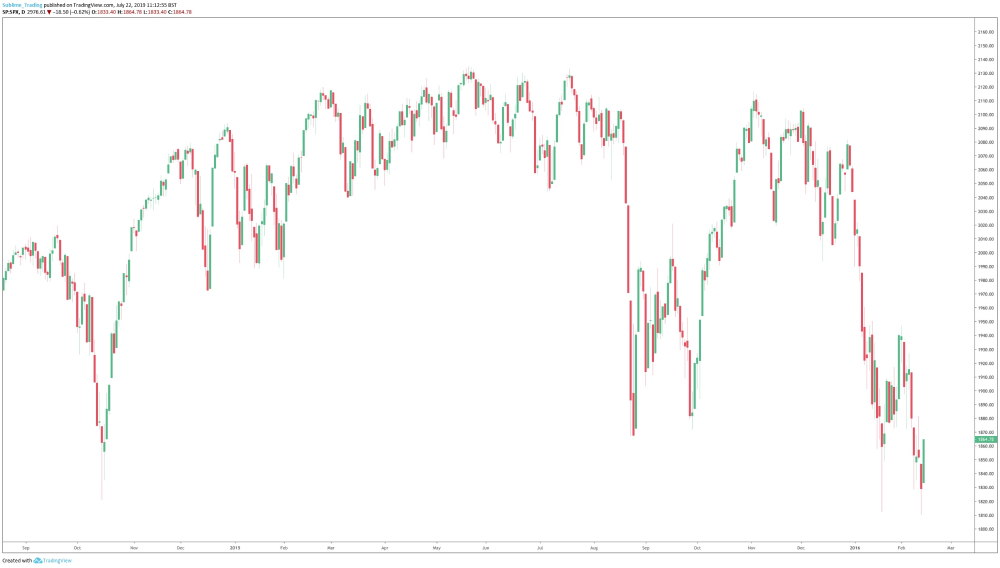
S&P 500 in an uptrend confirming we can take long trades in the stock market
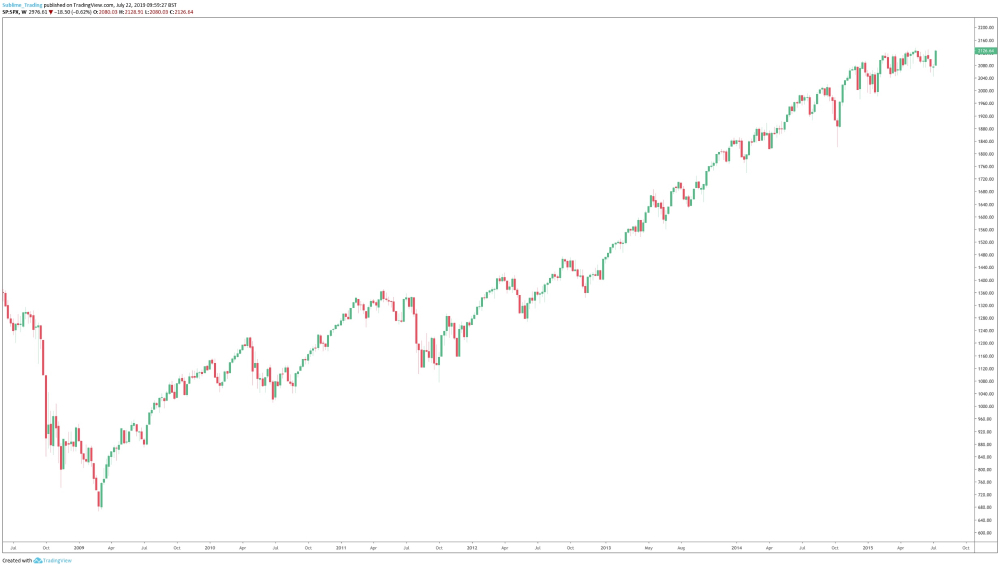
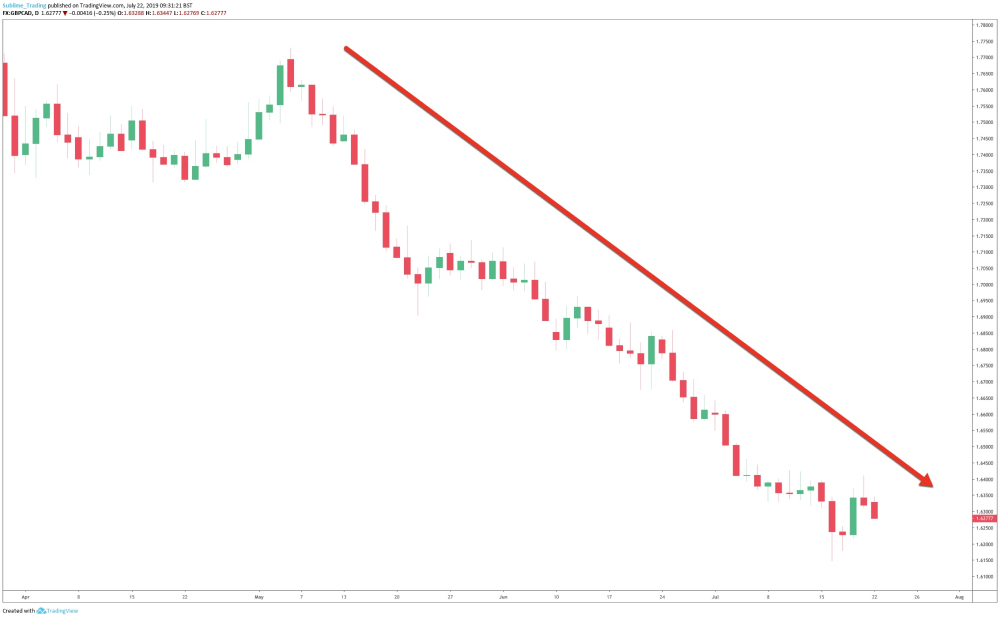
S&P 500 in an downtrend confirming we can take short trades in the stock market
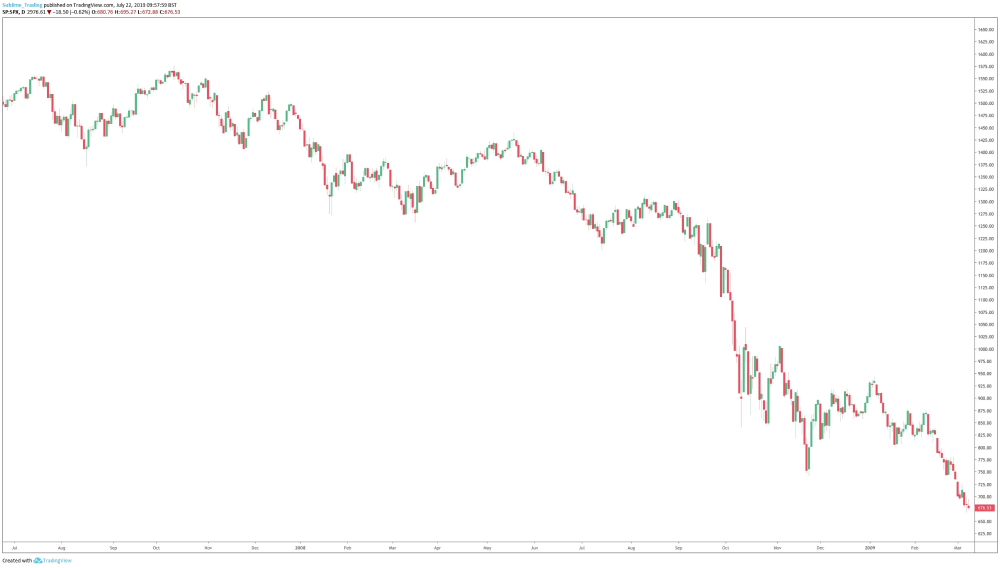
S&P 500 in consolidation confirming we should not take any trades in the stock market
If the S&P 500 is confirming a bull market, we can use our scanners to look for strong performing stocks that are doing better than the average. We can then buy or go long to make money. If the S&P 500 is confirming a bear market, we can use our scanners to look for weak performing stocks that are doing worse than the average.
We can then sell or go short to make money. If the S&P 500 is confirming a consolidating market, we stand side from investing in stocks altogether and protect our money. We can then also look for trends in forex, commodities or cryptocurrencies.
Using the S&P 500 as our guide is powerful as it removes the need for opinions, it removes the confusion and subjectivity of what market conditions we are dealing with and instead, paints a very clear picture of whether we should be buying, selling or standing aside.
No analysts telling you what is going to happen only for it not to happen, no self-sabotaging thoughts trying to second guess the market and no online gurus and keyboard warriors adding noise and clutter to what is actually very simple.

Step 4: Apply a strategy that works
Now you know how to scan, filter and use technical analysis to build a shortlist of the best-looking stocks that have the potential to trend for weeks, months even longer, what you then need is a strategy to extract profit from each of those stocks.
Remember, technical analysis is the process of breaking down a chart to determine its profit potential, investing is the ability to extract the full potential of profit as safely and as seamlessly as possible.
If you are just good at the analysis process, you are an analyst.
If you are not good at extracting profit, you are a bad investor which is often in line with gambling.
What you want is both strong technical analysis skills to find the best stocks coupled with the ability to extract profit to effortlessly grow an account.
So, let’s breakdown the 4 elements that make up a good strategy.
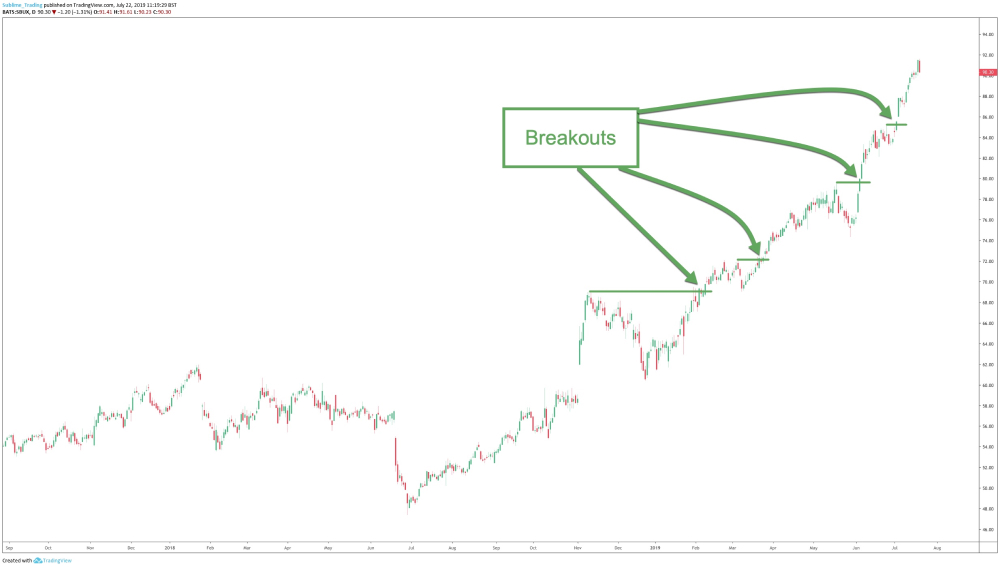
A Breakout Entry Point
There are a number of ways to enter into a stock, or any instrument, but the easiest by far is using what is called a breakout. A breakout is when price breaks and closes by the end of the trading day (remember from Step 1 our lowest timeframe is the daily timeframe) above a previous high (or a resistance area) indicating that the stock is looking to trend higher or when price breaks and closes by the end of the trading day below a previous low (or support area) indicating that the stock is looking to trend lower.
Breakouts
Breakdowns
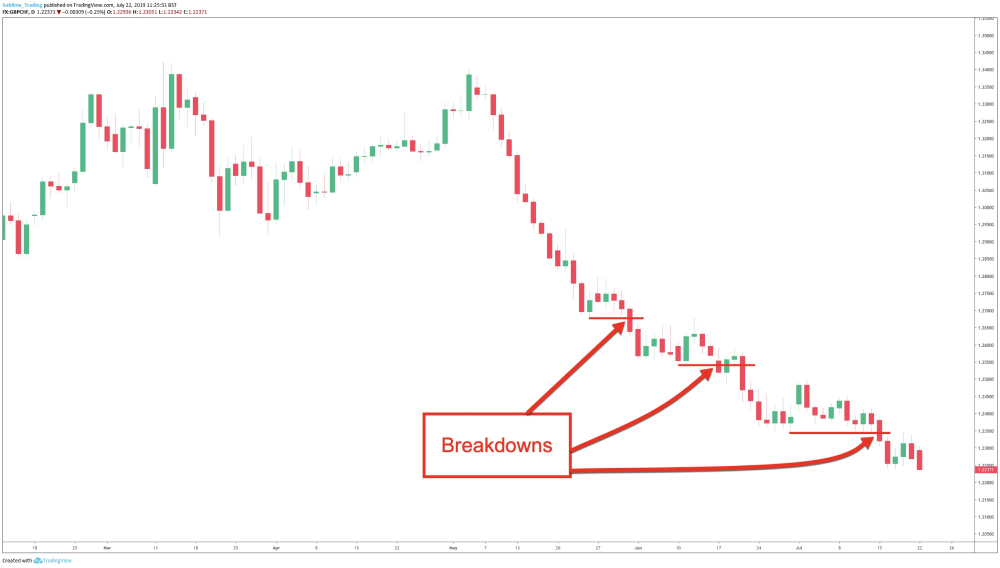
There are two main breakout points that investors look for:
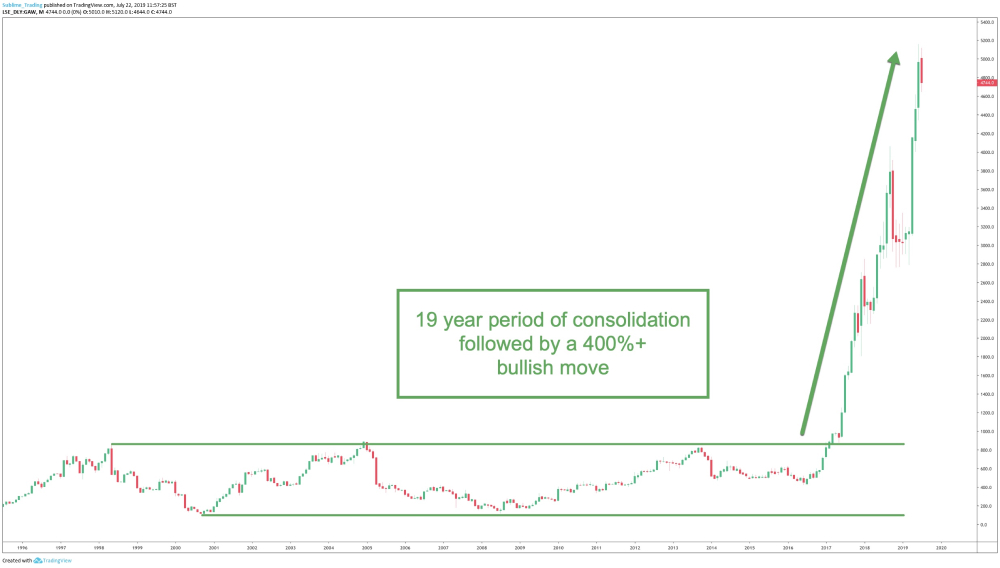
1. A breakout from consolidation:
There is an expression in investing which is the longer the consolidation the bigger the breakout and so finding stocks that are breaking out from lengthy periods of consolidation offer both excellent breakout entry points and profit potential.
Consolidation period followed by a strong bullish trend
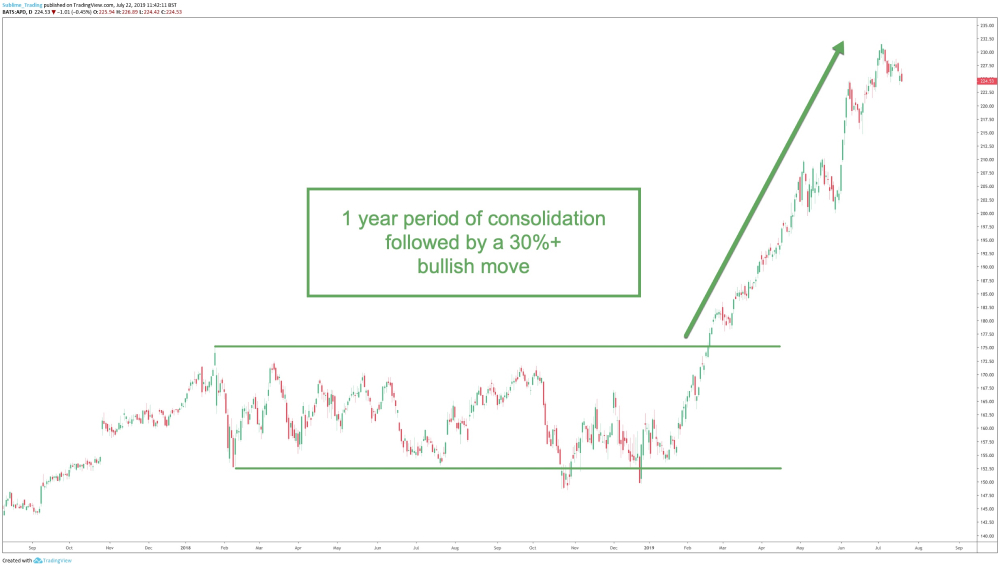
Longer period of consolidation followed by an even larger bullish trend
2. A breakout when price is already in trend:
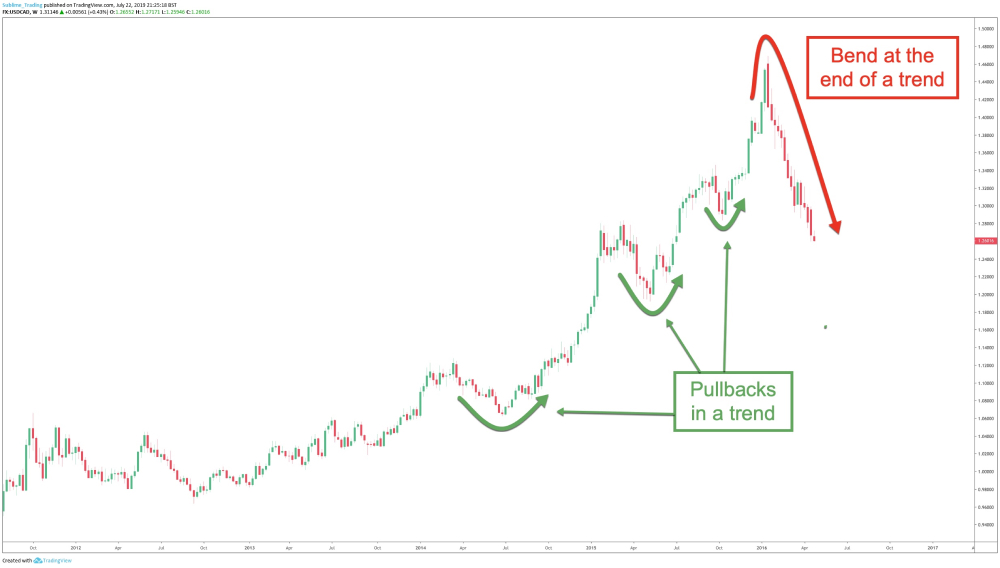
Once in a trend, price does not shoot off in a straight line which is what the novice investor would expect. What good investors look for in an attractive trend structure is “linearity” which is where price has an overall bullish or bearish direction to it but the trend structure itself is made up of strong moves in the direction of the trend but also weaker moves against the trend, called pullbacks, followed by strong moves back in the direction of the trend and so this repeats for the duration of the trend. Pullbacks are part and parcel of investing and should be expected and embraced. If the stock has been trending for some time, price is likely to pullback first and then move into a mini period of consolidation before breaking out into the next round of trend.
Breakouts are an excellent way to enter into a stock or any instrument for 2 main reasons:
-
They are very easy to recognise and so not shrouded in subjectivity.
-
They regularly occur offering multiple entry points.
A Well Placed Initial Stoploss
A stoploss is a predetermined level placed in your broker account where you want to exit an investment for a small loss if the stock goes against you and the investment fails. If the stoploss is too tight then you leave yourself open to being stopped out way too early on any small pullback in the market as we discussed above.
Having a stoploss too wide and you then run the risk of being caught in a losing investment longer than you need to be. What you want is a method that you can continuously apply to all stocks that creates a stoploss somewhere in the middle, one that is wide enough to give price the space and time to move to come good, as often price will move against you first once triggered into an investment before returning a profit, but also wide enough to suggest that if the stoploss has been triggered the trend has reversed and it is not just a pullback in the market.
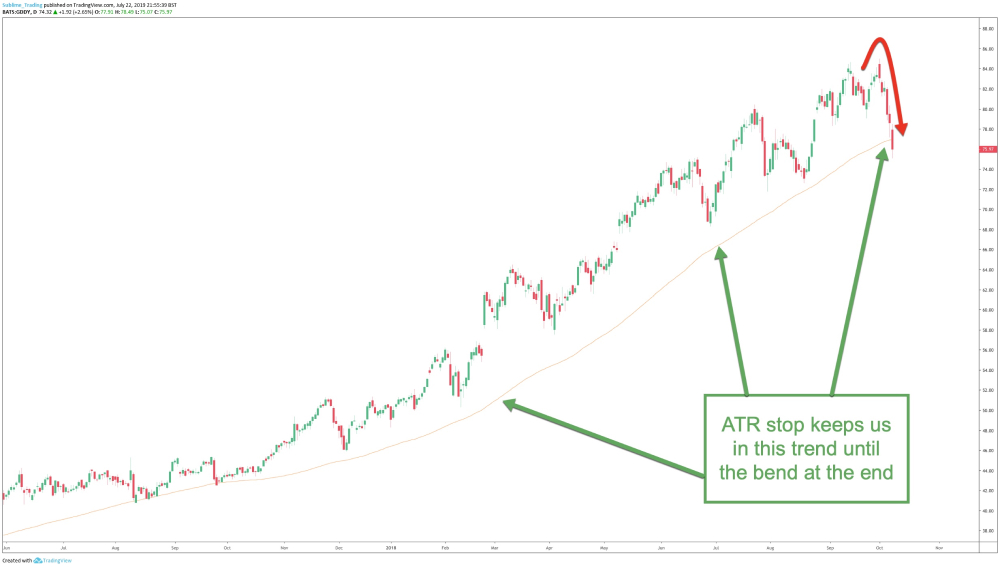
The simple moving average (SMA) stoploss keeps us in the trend and helps us to exit at the end of the trend
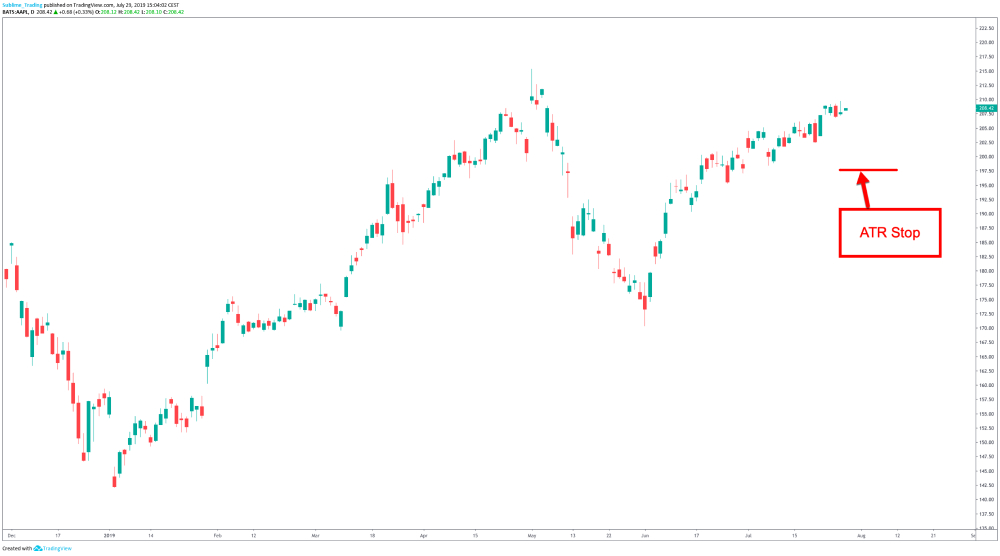
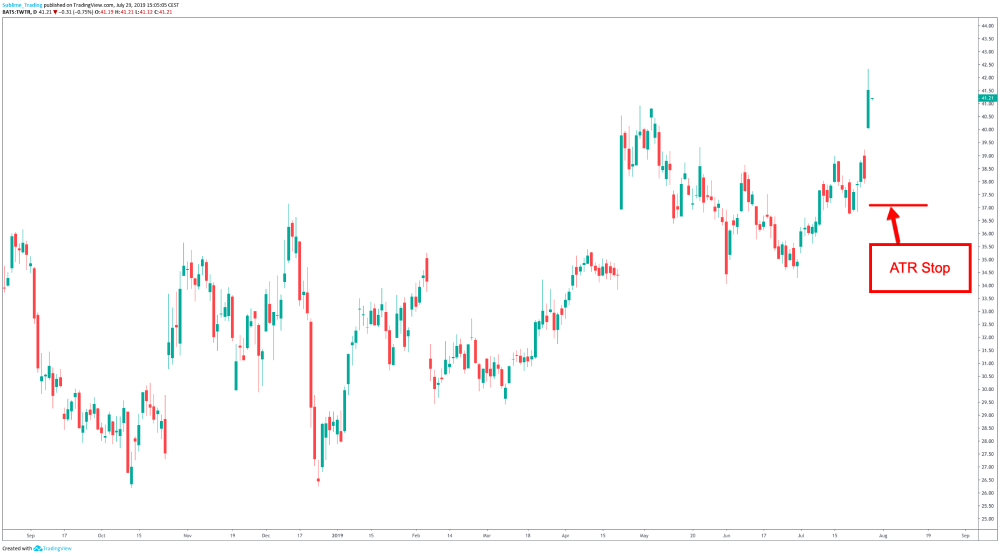
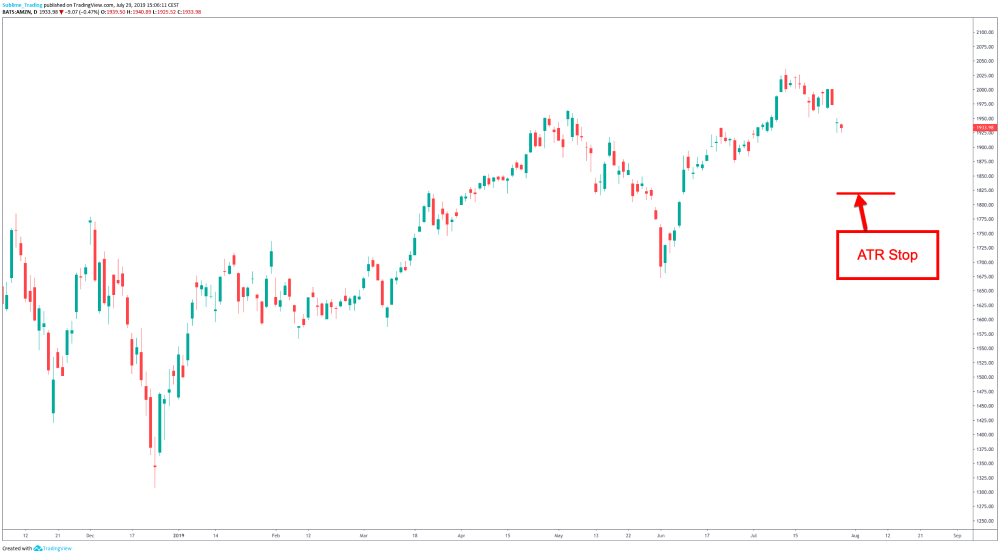
There are a number of methods investors use to calculate stoploss levels but for us here at Sublime, the best method is to use the ATR method. ATR stands for Average True Range and is how much an instrument moves on average over any number of days. In other words, it shows how volatile an instrument is.
So for example:
(At the time of publishing)
-
The ATR over 5 days for Apple is around 270 points
-
The ATR over 5 days for Twitter is around 100 points
-
The ATR over 5 days for Amazon is around 3000 points
All good charting packages will have a built-in tool that you can set to tell you what the ATR is over any number of days. Once we know the ATR, we can then use the following simple formula to calculate the stoploss:
ATR(5) x Multiplier = Stoploss distance from entry point
I have used ATR over 5 days just as an example but you could use any value you feel works best. In terms of multiplier, common values are between 2 to 4. So if we used 4, the stoploss for the above stocks would be:
Apple – ATR(5) x 4 = 270 x 4 = 1080 points from the entry point
Twitter – ATR(5) x 4 = 100 x 4 = 400 points from the entry point
Amazon – ATR(5) x 4 = 3000 x 4 = 12000 points from the entry point
The 2 main advantages of using the ATR method are:
-
It removes subjectivity and guesswork as to where to place a stop-loss.
-
The stop-loss is unique to the volatility of each instrument and keeps you in winning investments for the duration of the trend enabling you to take full advantage of the profit potential.
NOTE: “Points” is the term used to count the incremental moves to price when investing in a stock, it is not used in traditional investing. We go into more detail in our How to Choose a Broker PDF which you can download here.
Risk Management
Trading with an investment-style approach through an online broker account, such as a spread betting or CFD account, as opposed to investing the traditional way of buying physical shares through a bank has several advantages.
One of them being much better control over how much you want to risk per stock or any instrument that you are choosing to invest in. This is subject to ensuring you are using the correct broker account for you which we cover in the next and final step.
Many private investors often struggle with good risk management principles as they are lured in by the appeal of quick riches that brokers offer using leverage. Leverage involves borrowing a certain amount of the money from the broker needed to invest in a stock whereas with buying physical shares, you have to put up the whole amount that is required to be invested which can be a substantial amount.
Example Of How Leverage Works
In order to buy 100 actual shares of Nike at $85.97 you would need to put up $8,597 in cash.
With a leveraged account of 200:1 you would need to put up approximately $43 but have the same buying power of $8,597.
WARNING What private investors soon find out though is that leverage works not only for you but against you and without good risk management principles and well-placed initial stop-losses as we covered above, it is only a matter of time before you are staring at an empty investing account.

Good investing is ALWAYS about focusing on protecting your hard-earned money first, risking small and using that as a foundation to let the money come to you over the long-term as opposed to risking large and chasing money and quick riches which is a surefire way to large losses, blown accounts and heartache. It is unnecessary and does not have to be like that.
Here at Sublime Trading, we first ensure that the odds are very much in our favour through the scanning and analysis process outlined above to find the very best setups. Then we wait for the breakout entry point to materialise and then our risk management principles come into play:
-
We never risk more than 2% per investment.
-
We never expose our account risk to more than 20% across all investments.
Once in an investment, we then abide by the timeless and proven philosophy of letting winners run and cutting losers short.
This way:
By cutting losers short, losses are small, manageable and almost insignificant and so removing the stress, emotion and attachment to the investment. By letting winners run, you easily cover the small losses made through losing investments and effortlessly grow your account by letting winners run.
And to really accelerate the profit phase:
We embrace the power of COMPOUNDING, the worst kept secret in investing. This takes your profit from a straight line into an exponential curve.
NOTE: Compounding is when you add more of the same instrument to your portfolio and is best done when adding to winning instruments, so those in profit, ONLY.
Adding to already losing instruments just adds more risk to losing investments and increases the chance of large losses.
When done correctly and given the time and space to come good, compounding will change your whole belief-system on how money and growth is made.
Compounding is the very basis of doing a lot less to make a lot more, something day trading will never give you.
It is by following these very risk management principles that we grew our account by over 300% in 2017. Discipline and consistency is key in all aspects of investing and never more true than with managing risk.

Exit Management
Everyone seems to effortlessly be able to get into an investment, whether it be based on technical analysis or fundamental analysis, but very few know how to exit correctly and hence:
-
They often end up with much larger losses than intended.
-
They give back most or all the profit that has been accumulated.
Optimal entry points are important but the exit management is far more important as it determines how much profit or loss you leave with and also if you have taken full advantage of the profit a trending stock is handing out.
You certainly do not want to be in and out of a stock or any instrument even in a few days if you can be in it for much much longer compounding further and extracting more profit.
As the expression goes, the trend is your friend until the bend at the end
A bend and a pullback are not one and the same. A pullback, as mentioned above, is when price moves temporarily against the trend before continuing in the direction of the tend. A bend is when the market completely reverses direction.
There is no better method to exit management than using charts and revisiting the ATR method mentioned above when calculating a well-placed initial stop-loss.
Charts are great because:
-
You can see the trend structure and what kind of pullbacks you will be dealing with in each stock as trend structures vary from stock to stock.
-
You can create tools to highlight your exit management on the charts so when tagged, you have a non-subjective way of exiting from the stock or instrument you are in.
The ATR method is great because:
-
The same ATR formula used to calculate your initial stop-loss can be used as your exit management so when price starts trending, the stop-loss will follow price known as a trailing stop-loss (TSL).
-
The ATR trailing stop-loss is unique to each instrument and is designed to distinguish between pullbacks in the trend and the bend at the end.
The average true range (ATR) stop-loss keeps us in the trend and helps us to exit at the end of the trend
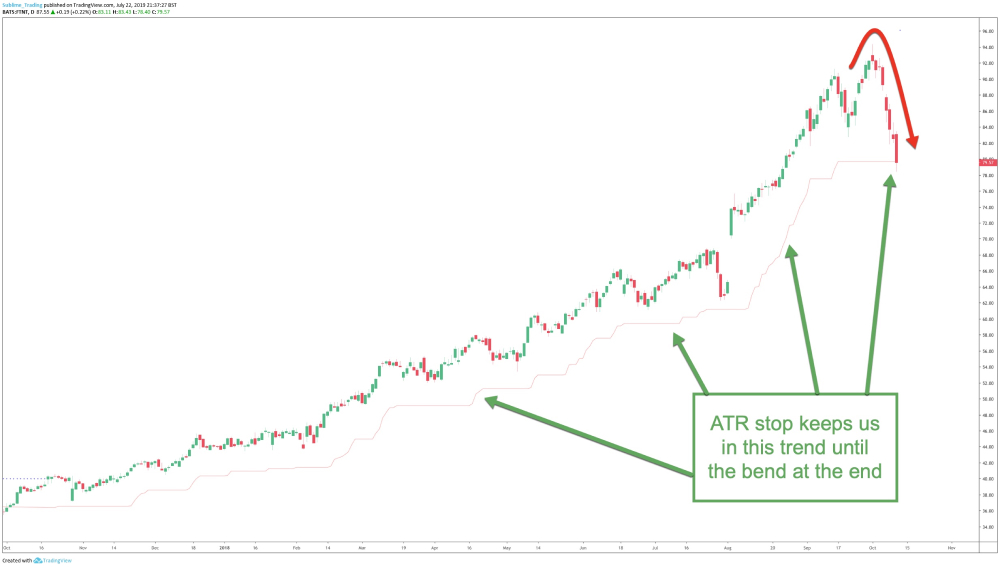
Here at Sublime, we like to keep all aspects of our investing as simple as possible. Using charts and the ATR method is both simple and highly effective in staying in investments for the duration of a trend, which can be weeks, months, even longer, and taking full advantage of the profit potential of trending instruments. The above image shows our ATR TSL tool.
The ATR method prevents us from being stopped out prematurely and gives price the space and time to move which means ample compounding opportunities and exponential growth on our investing accounts.
Good exit management means seamlessly growing an account by focusing on a few large winning investments and hence paying far less in broker fees, as opposed to the very real risk of blowing accounts through multiple trades a day as well as paying out heavy in broker fees.
Talking about brokers…
Step 5: Open an online broker account
Once you have found good trending stocks using a scanner, then used technical analysis and investing tools to break down charts and are then ready to apply a proven strategy to extract profit, the final step is to open and fund a suitable broker account to execute investments.
The internet is flooded with stock brokers, forex brokers, commodity brokers and now cryptocurrency brokers and so it can be a minefield shifting through them all and finding the right broker for you.

It is important to note that not all brokers are the same and that the most suitable broker for you is dependent on how much you are starting with.
As mentioned above, you want to choose a broker that allows you full control over your risk management principles and so if you want to risk no more than 2% and invest with a 500 point stop-loss then you should be able to do that.
This all boils down to how much you are starting with as some brokers are better suited for say a £2000 starting amount while with others you will need at least £20 000 to be able to follow your risk management rules. Of course, brokers will not tell you this and really just want you to open an account, fund it and start trading as they have a very different agenda to you…
…spreads and commissions where they will profit from all of your investments, the winners and losers.
We have gone into this in a lot more detail in our 9 Questions to Help you Choose the Right Broker PDF which you can download for free here. We go into detail on how to “position size” correctly which is how to ensure you are using the functionality of a broker account correctly to follow your 2% rule. It may sound simple enough and it is but it is one of the main reasons why so many fail at investing.
Brokers no doubt have to take some of the responsibility for people losing vast sums of money given how heavily they promote short-term trading but investors have to take the bulk of the responsibility in not knowing how to use their broker account most effectively.
In fact, most private investors choose broker accounts based on how much money they can make as quickly as possible and fail miserably when the correct approach is to choose a broker account that best allows you to protect your money first by giving you the freedom to position size and follow your 2% rule impeccably.
If you are already in and out of positions with an online broker and struggling to make consistent profit, then your whole approach including your broker account will need a serious rethink.
Don’t worry though, we have you covered in our free PDF.
Shorting a market
Now one of the main advantages to opening an online broker account as opposed to buying physical stocks the traditional way is the ability to short a market.
As already discussed, markets move in cycles, they move up, down and sideways. Good investing is about recognising what cycle you are in and building a portfolio around the best looking instruments in that cycle and then knowing when to exit from those instruments when the cycle ends and the market turns.
For example, a market could be in a bullish cycle for 12 months where you have held investments and made excellent profit and then the market turns. You then exit from your investments using the ATR trailing stop-loss as discussed above.
The market then goes into a period of consolidation but then breaks out into a bearish cycle.
Now where many newbie investors go wrong is looking to apply the buy low sell high philosophy here and to buy stocks at bargain prices as prices drop but what many find out is that stocks can keep on dropping causing losses upon losses.
Also, there will be many who have not exited from their long positions in the previous bull run and who are still holding onto their “buy” investments only to give back all the profit they have made as the market is now in a bear cycle. As there is no pre-thought out understanding of market cycles and no pre-thought out exit management in place, it then becomes a hold and hope approach which can take years to recover from.
With good charting skills, you can easily avoid these mistakes and learn to recognise not just a bull market but also a bear market and with the right broker account for you and your starting amount, take full advantage of the profit being handed out in a bear market by shorting stocks and other instruments.
Having an online broker account then allows you to continuously grow an account by moving between a bull market and a bear market and by also moving between stocks, forex, commodities and cryptocurrencies.
Simply buying and holding physical stocks the traditional way has its place but is far more limiting compared to investing online.
Tax-free returns
Finally, for those based in the UK, opening an online spread betting account not only allows you to short a market and not only gives you full control over your risk management…
…but also has the very appealing status of tax-free benefits if investing is not your primary income so why would you want to invest/trade any other way?
Spread betting tends to have a bad rap which is sad as remember, people fail not because they are using a spread betting account but how they are using the spread betting account with leverage and greed as their primary driver. Greed never pays.
I have even heard spread betting being mistaken for a “strategy” which is really weird. It just shows how little people are willing to educate themselves on the amazing opportunities out there in this online digital world we now are in.
Spread betting accounts are a safe and an excellent way to wealth creation. Many of our community members have stated that if they knew how a spread betting account works, they would have started using one a long long time ago.
Summary
I hope this blog piece has given you a thorough breakdown and run-through of what is needed to successfully build a stocks portfolio and that can also be applied to the forex, commodities and cryptocurrency markets.
Here is a quick summary of the main points:
Step 1 – Learn to read charts and apply good technical analysis skills to establish high-probability setups.
Step 2 – Invest in good scanning software to seamlessly scan through 1000s of instruments to find the best of the best instruments saving you A LOT of time doing this manually as well as totally eliminating the noise and confusion that comes with following news and opinions.
Step 3 – Let the S&P 500 guide you on market conditions so you know if you are in a bull market to go long, a bear market to go short or a sideways market to stand aside and again to eliminate the noise and confusion that comes with news and opinions.
Step 4 – Use a proven trend following strategy that cuts losers short and lets winners run and embraces the power of compounding to take your profit line from a straight line to an exponential curve.
Step 5 – Open an online investing account that is appropriate for your starting amount which allows you full control over your risk management and go long in a bull market and short a bear market.
Getting Started
To help you get started, we have created a free 4-part training series on trend following and where we share the very techniques we used to achieve over 300% in the last bull run in stocks. With the S&P 500 now showing early signs of the next bull run, there is no better time to get started to learn how to build your own successful long-term stocks portfolio.
As always, keep it simple, keep it Sublime!