

Welcome to our weekly newsletter where we provide an overview of the main US and UK indices, along with analyses of selected assets that are outperforming the market.
Let’s get into this week’s newsletter!

US & UK INDICES OVERVIEW
This week the strength in the US equity markets has continued, resulting in further all-time highs in the three main indices – S&P 500, Nasdaq and Dow Jones. As mentioned last week, this confluence of strength gives us confidence that the momentum we have seen since November will continue in 2024.
The S&P 500 closed the week at 4891, a gain of 1.1%. January is proving to be another strong month with a gain to date of 2.5%. The index has gained 19% since the pullback in October and a gain of 39% since the October 2022 lows.
The bulls remain in control of the equity markets which aligns with our long term position.
We continue to see individual stocks perform well. Our portfolio currently compromises over 20 US stocks. We have compounded a number of these assets, in turn, delivering excellent profit for our Phoenix community members.
The FTSE 100, the UK’s premier index, closed the week with a gain of 2.3%, to close back above the weekly 50 SMA. Price remains range bound between 7200 and 7750. Should strength return, the next major area of potential resistance is the pivot high from 17 April at 7936. The all-time high is 8047. We continue to monitor this index, waiting for confirmation of direction.
PERFORMANCE REVIEW
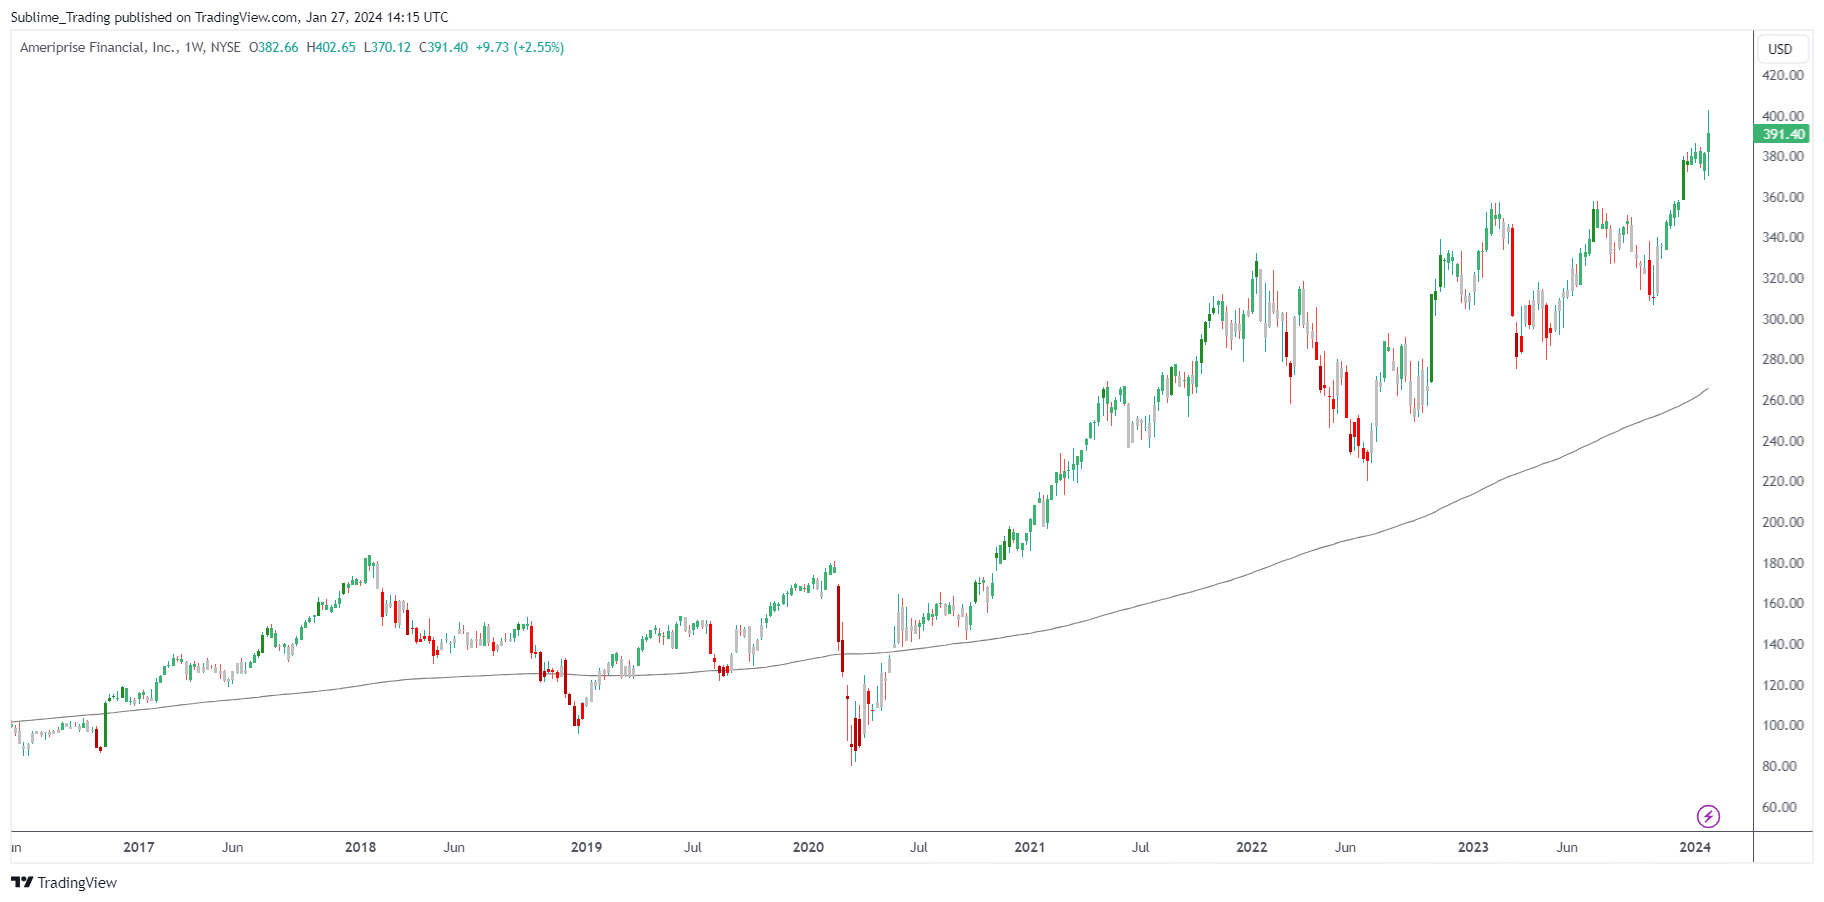
Ameriprise Financial – AMP
Ameriprise is a stock with a history of trends over the past 10 years. These trends, such as 2013 and 2020 have been linear and predictable.
Our breakout strategy initially entered AMP in December 2020. Further positions have been taken as price has moved in our favour. Commencing in November, price has been particularly bullish with a total gain of 24%, resulting in an all-time high of $403 this week.
The total performance to date is a 1,386% Return On Investment, and 28% Return On Capital, applying a full portfolio risk of 2%.
This stock is a good example of a trending stock in a volatile market. The total amount of time required to set up and manage this trade has been less than six hours over three years – this is the benefit of trend trading; using higher time frames such as monthly and weekly charts avoids the noise and stress of shorter time frames. This approach enables busy professionals the freedom to pursue other interests and avoid hours each day in front of a trading screen.
OUTPERFORMING ASSET FOR THE WATCHLIST
Microsoft Corporation – MSFT
Microsoft (ticker: MSFT) needs little introduction. as the most prominent software seller dominating the PC market with its uber-popular Windows operating system and Office software packages. They also broke into gaming in 2001 with the Xbox. Microsoft ranked No. 14 in the 2022 Fortune 500 rankings of the largest United States corporations by total revenue; it was the world’s largest software maker by revenue as of 2022. It is considered one of the Big Five American information technology companies, alongside Alphabet, Amazon, Apple, and Meta.
Since July 2016, MSFT has maintained a robust long-term trend, solidifying its status as a noteworthy stock. Over this period, the price has surged by an impressive 535%. For trend followers, MSFT undeniably stands as the king of stocks, exemplifying its remarkable market returns.
Closing the week at $404, MSFT printed a new all-time high. Throughout 2022 price experienced an uncharacteristic decline, resulting in a bottom in November at $213. In 2023 price was bullish, resulting in a gain of 57%. January has continued the trend with a gain in the month to date of 7.4%.
On the weekly time frame, MSFT continues to trade above the 50 and 200 SMAs. Our proprietary tool, the Sublime trend filter, is green, reinforcing the bullish outlook. Between July and October price entered a period of consolidation, with a break out on 6th November.
Whilst on the daily time frame, the Sublime trend filter also remains green. MSFT is also trading above the 20, 50, and 200 SMAs. Furthermore, the moving averages are aligned and diverging, indicating near-term strength.
Looking ahead, with a recent close above a key level at $400, we will now monitor price. Should a continuation pattern emerge above the all-time high and round number, MSFT could present an opportunity for our Phoenix community members, who have profited handsomely in this stock for a number of years.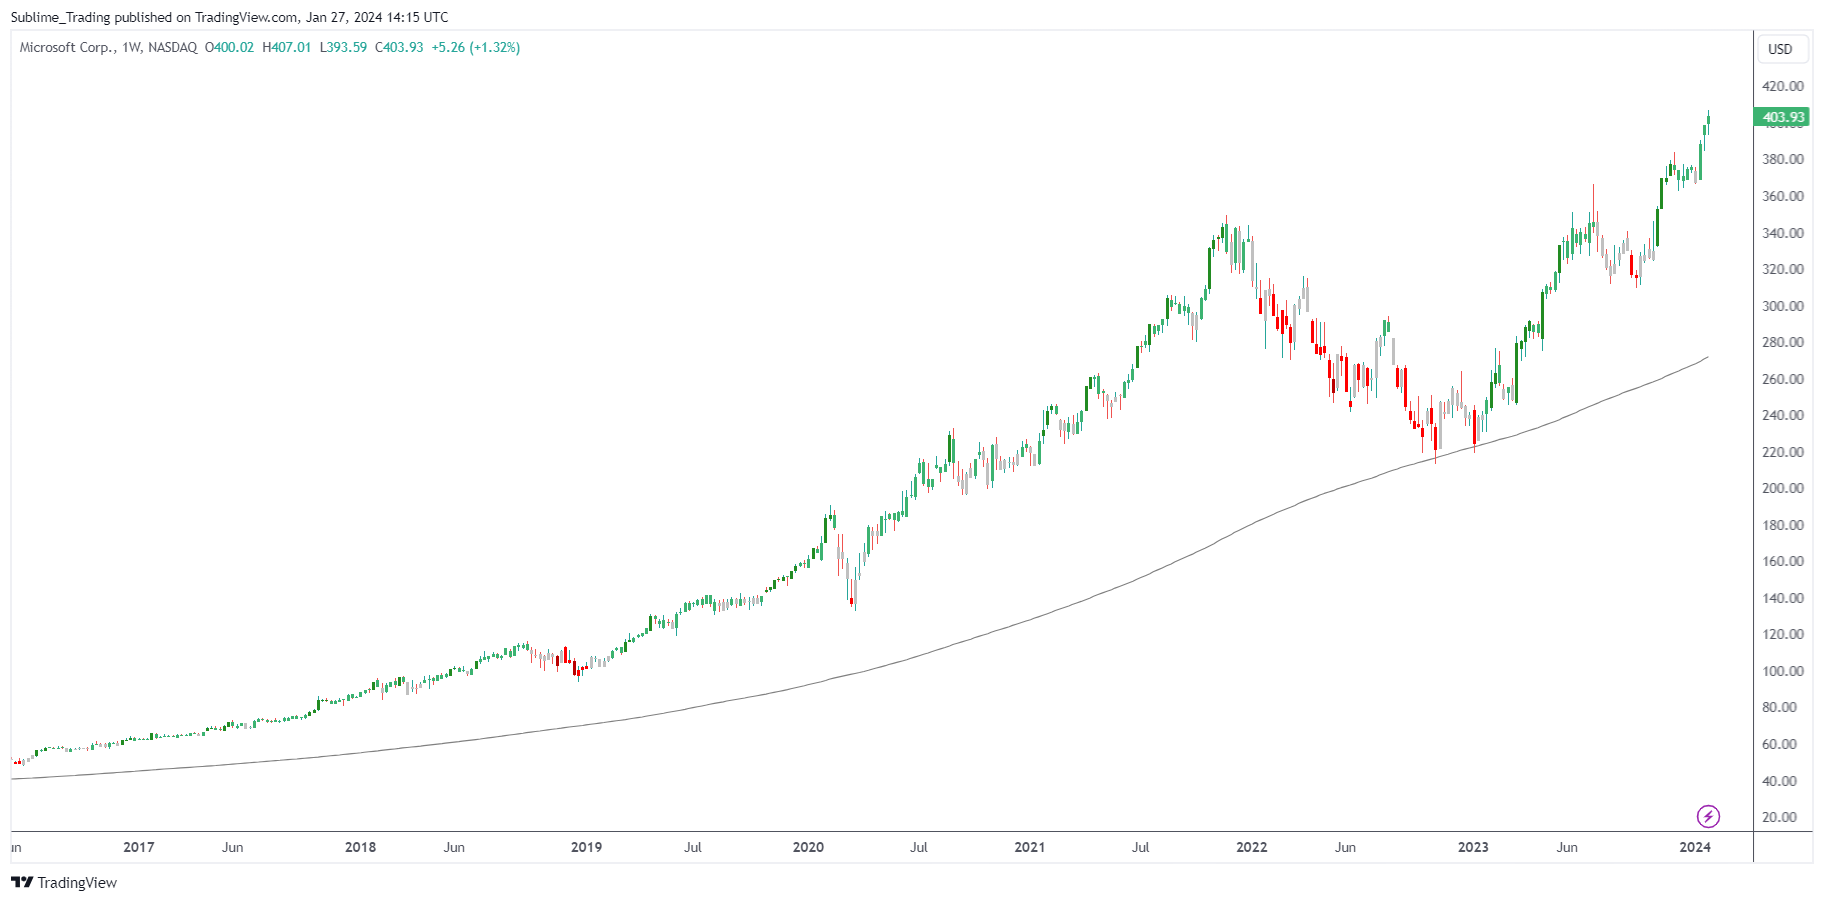
Looking Ahead
As we have commented in recent weeks, the bulls remain in control of the US equity markets. We have a large number of positions which are profiting from this momentum. As always, we will let price dictate our next move.
At Sublime, our unwavering commitment lies in conducting thorough analysis based on objective data and factual evidence presented in the charts. By adopting this approach, we aim to provide valuable guidance to our esteemed Phoenix community, collectively exploring opportunities that hold the potential for long-term, profitable trades.
Keep it simple. Keep it Sublime.
The ST Team
P.S. Answer 21 rapid-fire questions about your investing approach and then as if by magic, we will give you recommendations that are right for you and you’ll unlock your FREE Bonuses that will improve your investing results over the next 3 to 5 years.