

Continuing from last week’s observations, for the past three months price has struggled to break above the pivot high from 2015 at 7124. Whilst price is supported by the weekly 200sma, daily 50sma and the 7000 round number. As trend traders, we remain patient, and aware that long periods of consolidation are often followed by large breakouts and long trends.
The Sublime trend filter continues to remain green on the weekly timeframe, with price this week closing above the 200sma.
On the daily timeframe below, we can see that since mid-May price has been using the 50sma as support. Last week price pulled back to the pivot low of 13 May, and subsequently found the strength to close above the 20sma, 50sma and 7000 round number. The Sublime trend filter continues to alternate between grey and red, indicating price is in a period of indecision. However, our bias overall remains bullish, and we continue to look for stocks outperforming the Index.
A stock in a long term trend however there has been periods of consolidation and deep pullbacks. Price is currently trading above last year’s high. July is displaying a large, bullish candle and price has created an ATH at £33.76.
On the weekly timeframe, price is trading above the 50sma and 200sma. The Sublime trend filter is green.
On the daily timeframe below, the Sublime trend filter is green, and price is above the 20sma, 50sma and 200sma. Since breaking out from resistance in May 2020, price action has been mixed, with impulsive moves followed by pullbacks. The MAs are now neatly aligned and we will apply patience to see if a linear trend can develop. Will will update our Phoenix community of any further developments in this stock.
A stock we have been trading since last year, this week price created an ATH at £84.32. July’s performance to date has continued the bullish trend with a gain exceeding 12%. This follows June’s increase of 5%. Year to date price has increased by an impressive 26%.
On the weekly timeframe, price is trading above the 50sma and 200sma, and the Sublime trend filter is green. Since the breakout from consolidation in May, price retested the resistance-turned-support level and £70 round number.
On the daily timeframe below, price is above the 20sma, 50sma and 200sma, and the Sublime trend filter is green. The patience we have previously discussed is paying off, as there is evidence of a strong, linear trend. We will continue to share signals with our Phoenix members, particularly if we see such a trend develop towards the next round number at £100.
We recently highlighted this stock as one to watch, and this week’s bullish move is paying dividends for our Phoenix community members. July’s candle is bullish with a 9%, and this month represents the ninth consecutive month of gains. In turn price has created a new ATH at £16.30.
On the weekly timeframe, price is above the 50sma and 200sma, and the Sublime trend filter is green.
On the daily timeframe below, this week price broke out from a small period of consolidation going back to early July. Price is above the 20sma, 50sma and 200sma, and the Sublime trend filter is green. We will continue to update Phoenix members of compound opportunities as this trend develops further.

Over the past week, there hasn’t been any notable change in July’s candle, which remains bullish with a 2% gain. As we are at the end of the month we don’t anticipate any major change and this should result in July being the sixth consecutive month of gains. Price created an ATH this week at $4,431.
On the weekly timeframe, price continues to trade above the 50sma and 200sma, and the Sublime trend filter remains green.
On the daily timeframe below, price is above the 20sma, 50sma and 200sma, and the Sublime trend filter is green. The bulls remain in firm control of the S&P, and we continue to look for stocks that are outperforming the index.
A stock with a good history of long term trends. Price in July is displaying a large bullish candle with a gain to date of 5%. Price this month created a new ATH at $290, and is now trading well above last year’s high at $272.
On the weekly timeframe, price is trading above both the 50sma and 200sma, and the Sublime trend filter remains green.
On the daily timeframe below, price is trading above the 20sma, 50sma and 200sma, and the Sublime trend filter is also green. Price is showing signs of developing a linear trend. The next area of resistance is the $300 round number. We will apply patience to assess how the trend develops and update our Phoenix community as any high probability trading opportunities present.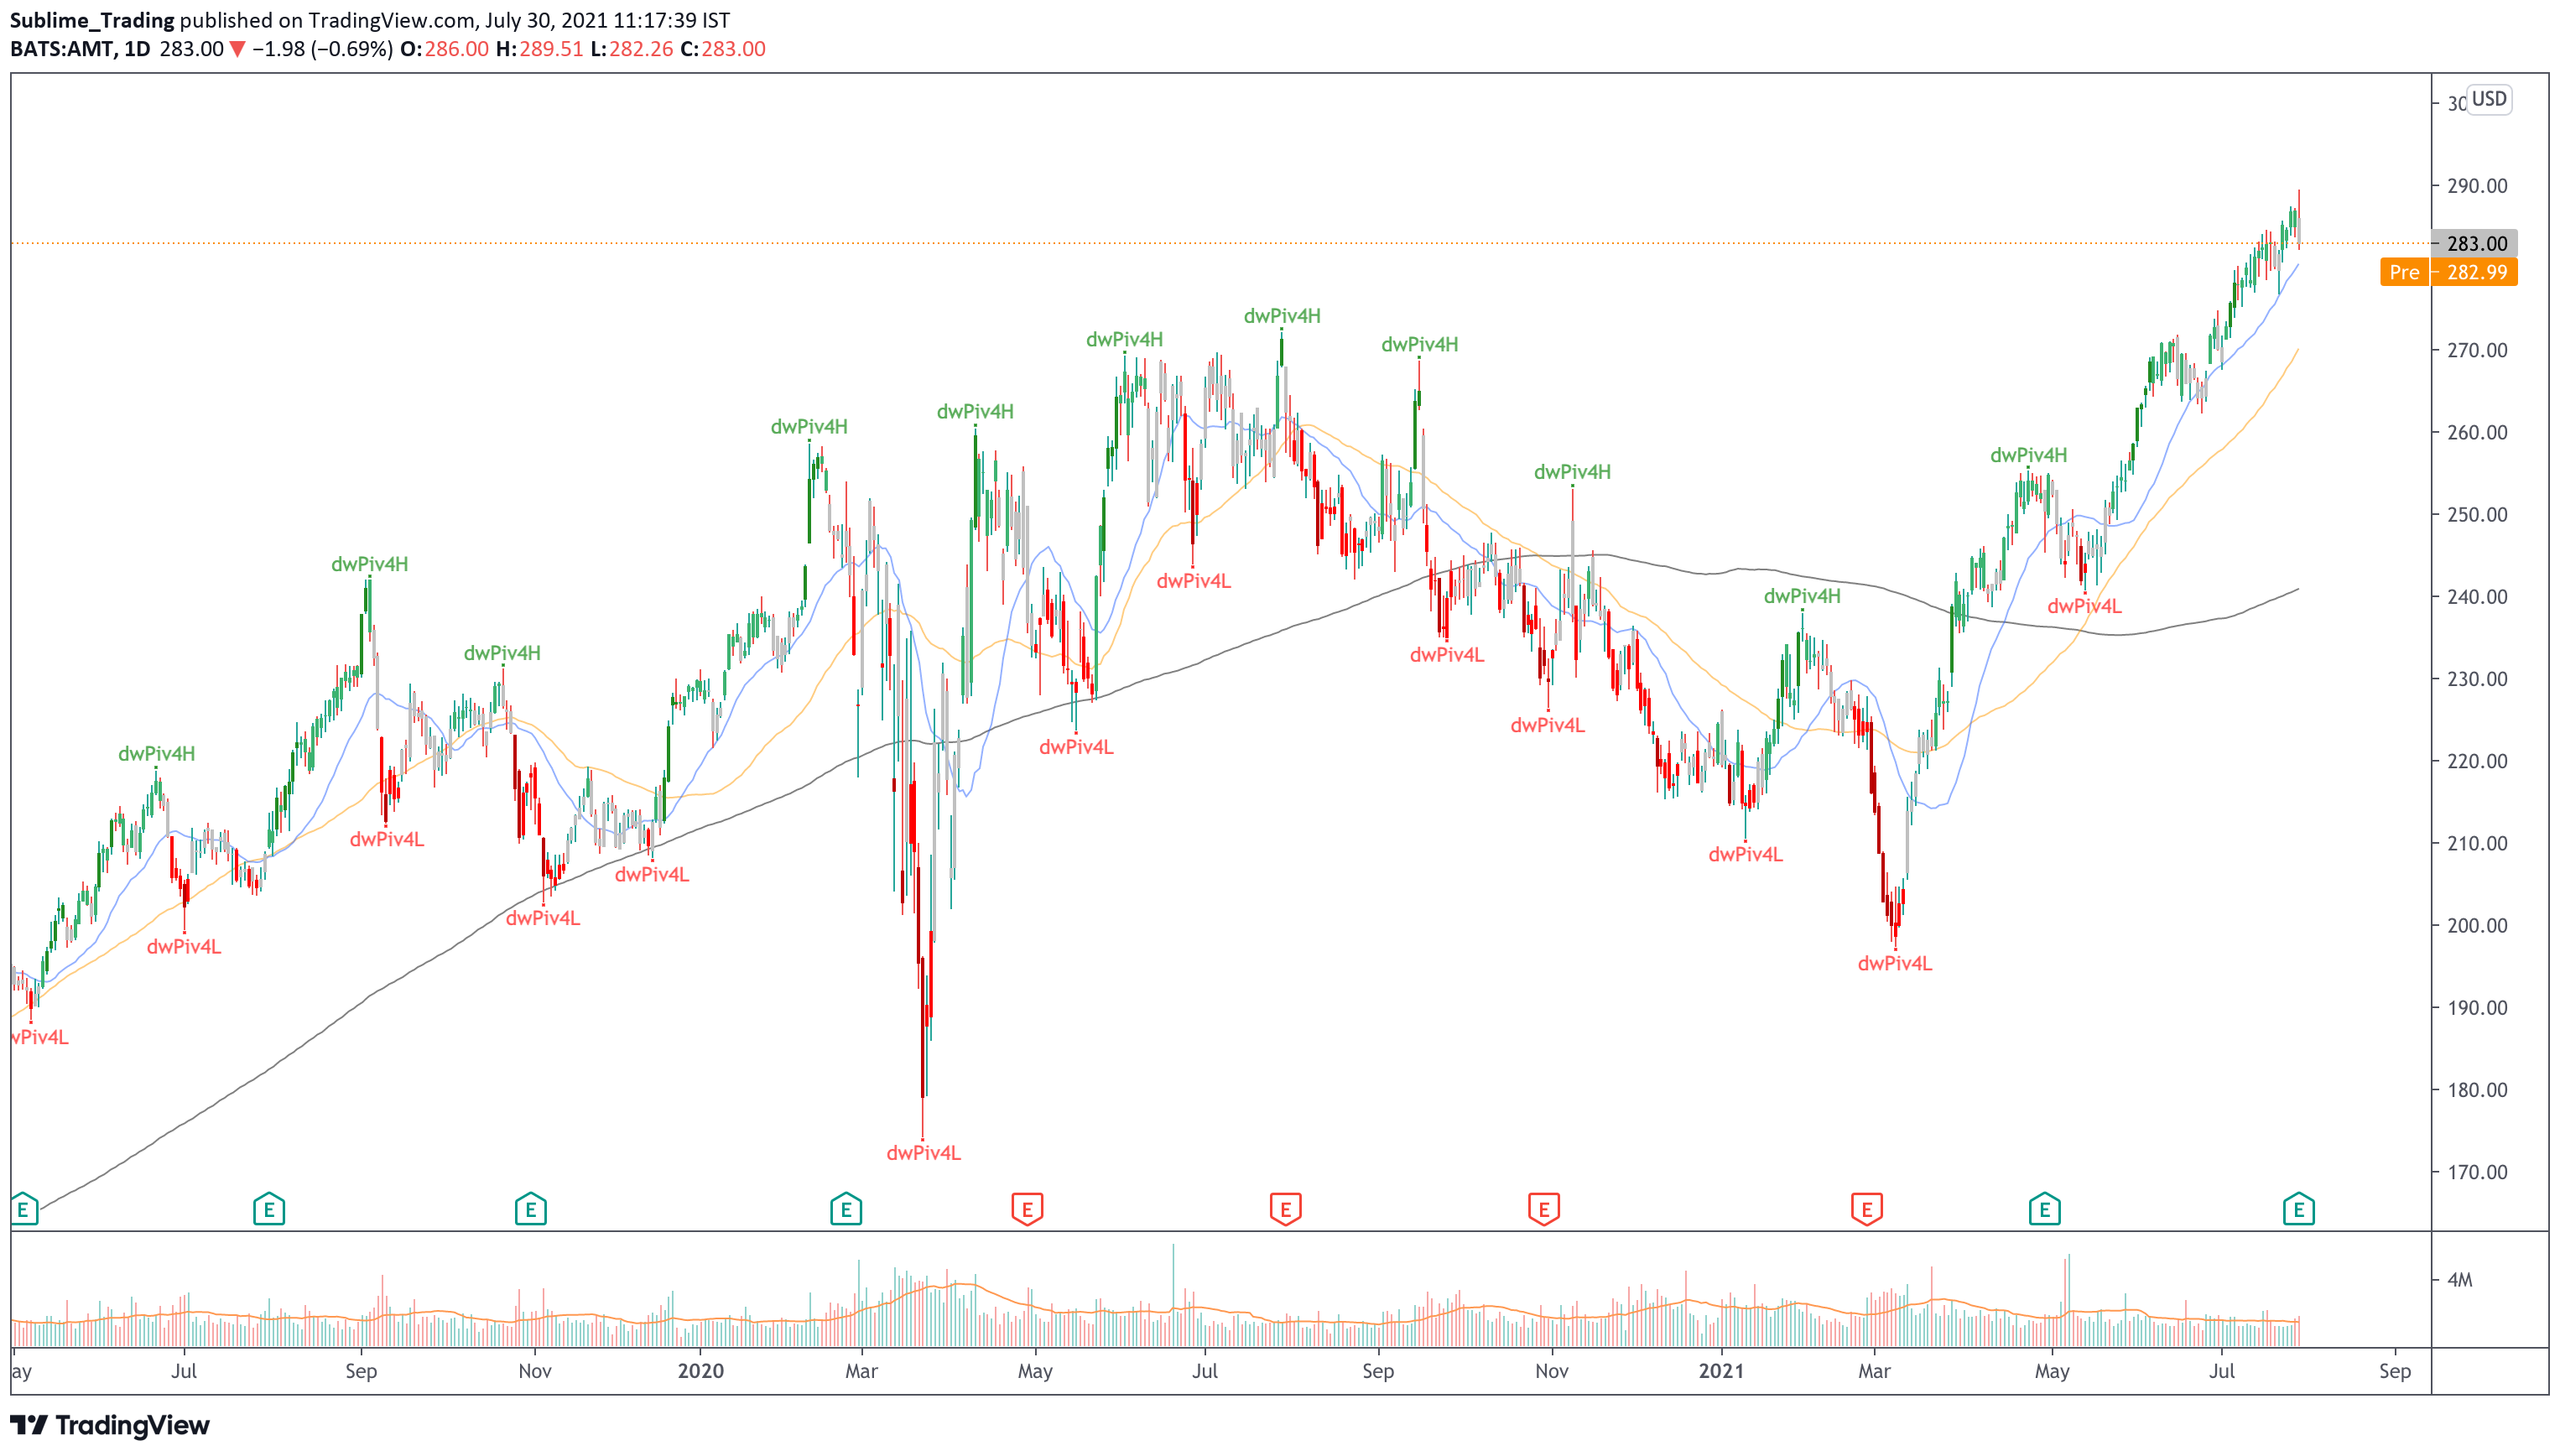
The overall trend in this stock is strong over a number of years. Prior to the pandemic price rose to the $50 round number. This level became a strong area of resistance which price failed to break through in the latter part of 2020. In April price broke out of resistance with a 16% gain. May and June were indecision candles. The candle for July is bullish however there is a long wick above price.
On the weekly timeframe, price is above the 50sma and the 200sma and the Sublime trend filter is green.
On the daily timeframe below, price is above the 20sma, the 50sma and the 200sma and the Sublime trend filter is also green confirming alignment with the weekly timeframe.
On the daily timeframe below, this week price is above the 20sma, 50sma and 200sma, and the Sublime trend filter is green. Earnings were on Monday which caused the price spike. With earnings out of the way, a continuation pattern above the current level could offer an opportunity to Phoenix members. The next area of resistance is the $100 round number.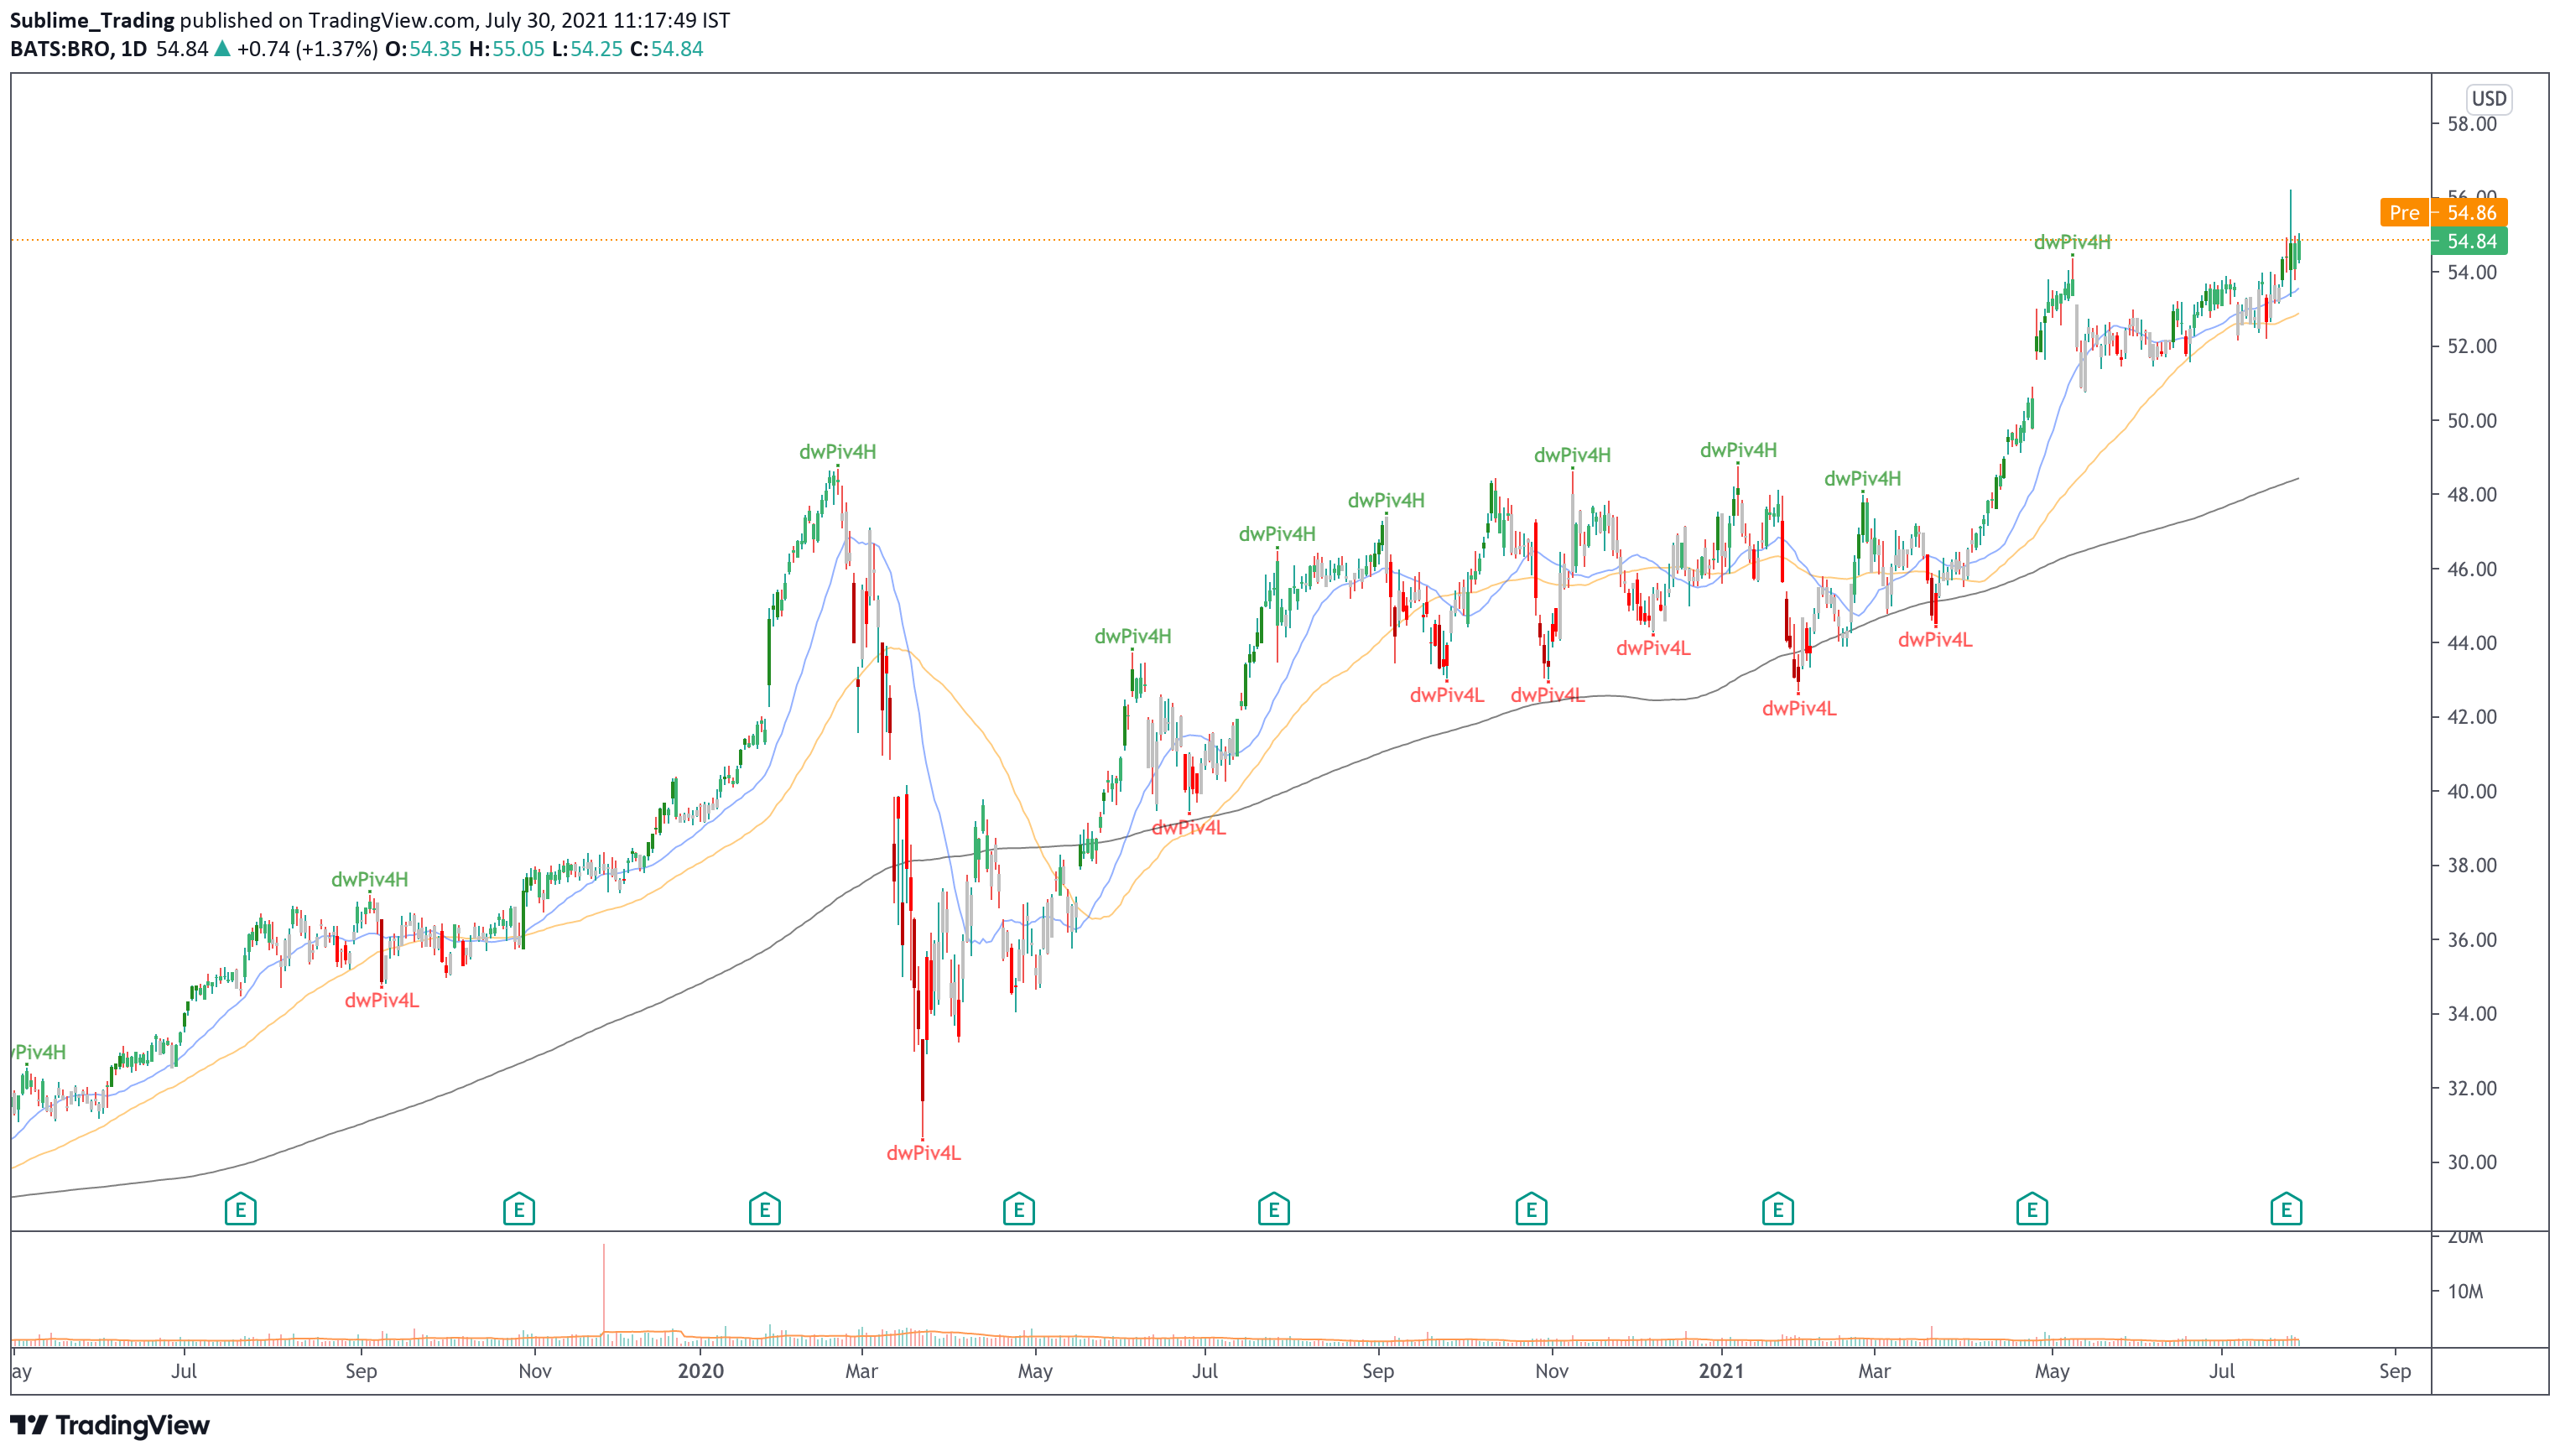
The history of this stock has great appeal. A bullish 27% move in April resulted in price creating an ATH and break above the $200 round number. Price action in May and June was indecisive, which was to be expected before its next move. In July the bullish momentum has recommenced with a 9% gain and new ATH at $261.
On the weekly timeframe, price is trading above the 50sma, and the 200sma and the Sublime trend filter is green, confirming a bull trend in play.
On the daily timeframe below, price is trading above the 20sma, 50sma and 200sma. The Sublime trend filter is also green. Following the gap up from April earnings, price has continued higher, using both the 20sma and 50sma as support. We will continue to share signals with our Phoenix community, as price works its way towards the next level of resistance, being the $300 round number.
A stock with a short and mixed history. Following its float in February 2017, price was initially in a period of consolidation. From April 2019 price created an impulsive move higher. Price there suffered a strong reversal due to the pandemic, falling to $16. Price has since demonstrated strength and broke out above resistance in April 2021. Since then price has gained 24%, including a gain of 9% in July.
On the weekly timeframe, price is trading above both the 50sma and 200sma, and the Sublime trend filter remains green.
On the daily timeframe below, price is trading above the 20sma, 50sma and 200sma, and the Sublime trend filter is green. The MAs are neatly aligned, indicating a linear trend. With earnings now passed we can consider entry opportunities. We will update our Phoenix community if any high probability opportunities emerge.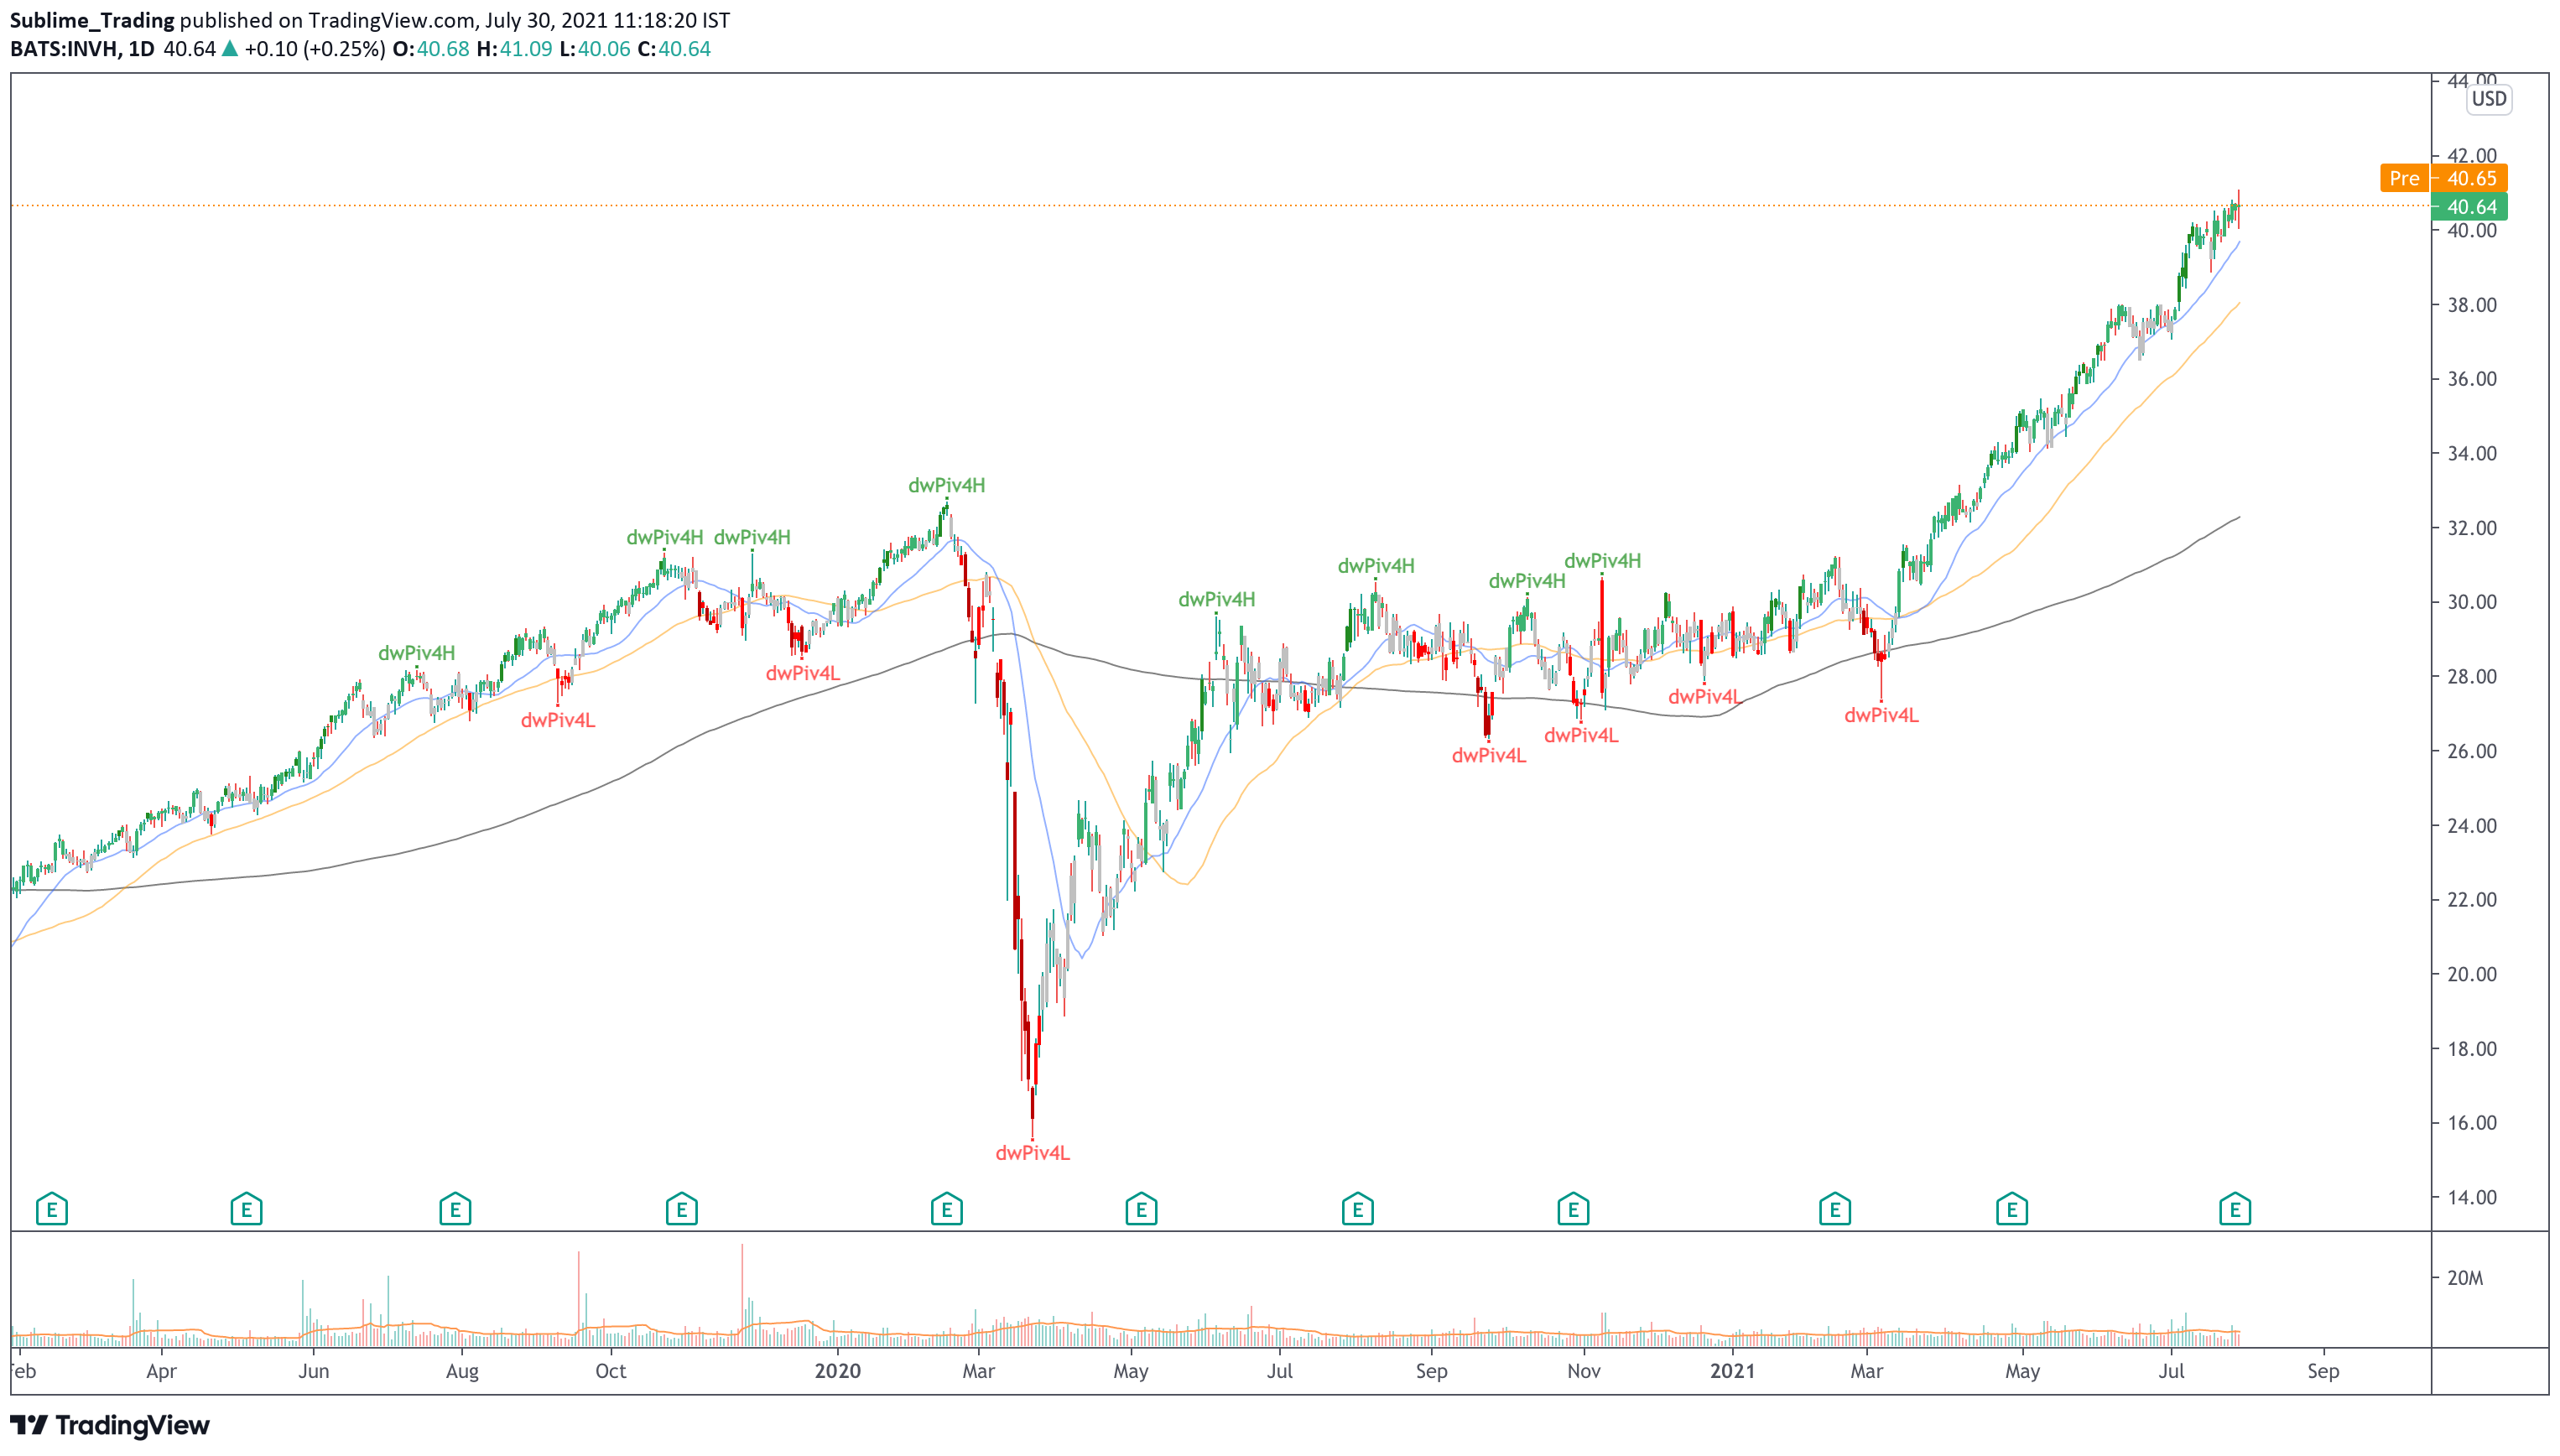
A stock in a long term trend and in recent months has displayed good momentum. Since breaking above the previous year’s high at $149 price has been bullish with a gain of 30% including 15% in July.
On the weekly timeframe, price is above the 50sma and the 200sma. The Sublime trend filter is green.
On the daily timeframe below, the Sublime trend filter is green, and price is above the 20sma, 50sma and 200sma. Since breaking out from resistance in April this year price has been using the 20sma as support. Will will update our Phoenix community of any further developments in this stock.

A stock with a mixed history of trends and long periods of consolidation. July is displaying a bullish candle with a gain of 6%, resulting in a new ATH at $271.
On the weekly timeframe, price is above the 50sma and the 200sma and the trend filter is green.
On the daily timeframe below, price is above the 20sma, 50sma and 200sma and the Sublime trend filter is also green confirming alignment with the weekly timeframe. Over recent months the periods of consolidation have been shorter, indicating that this stock may be ready to form a linear trend. Following this most recent breakout, we will monitor the stock for signs of a linear trend, and update the Phoenix community accordingly. The next area of resistance is the $300 round number.
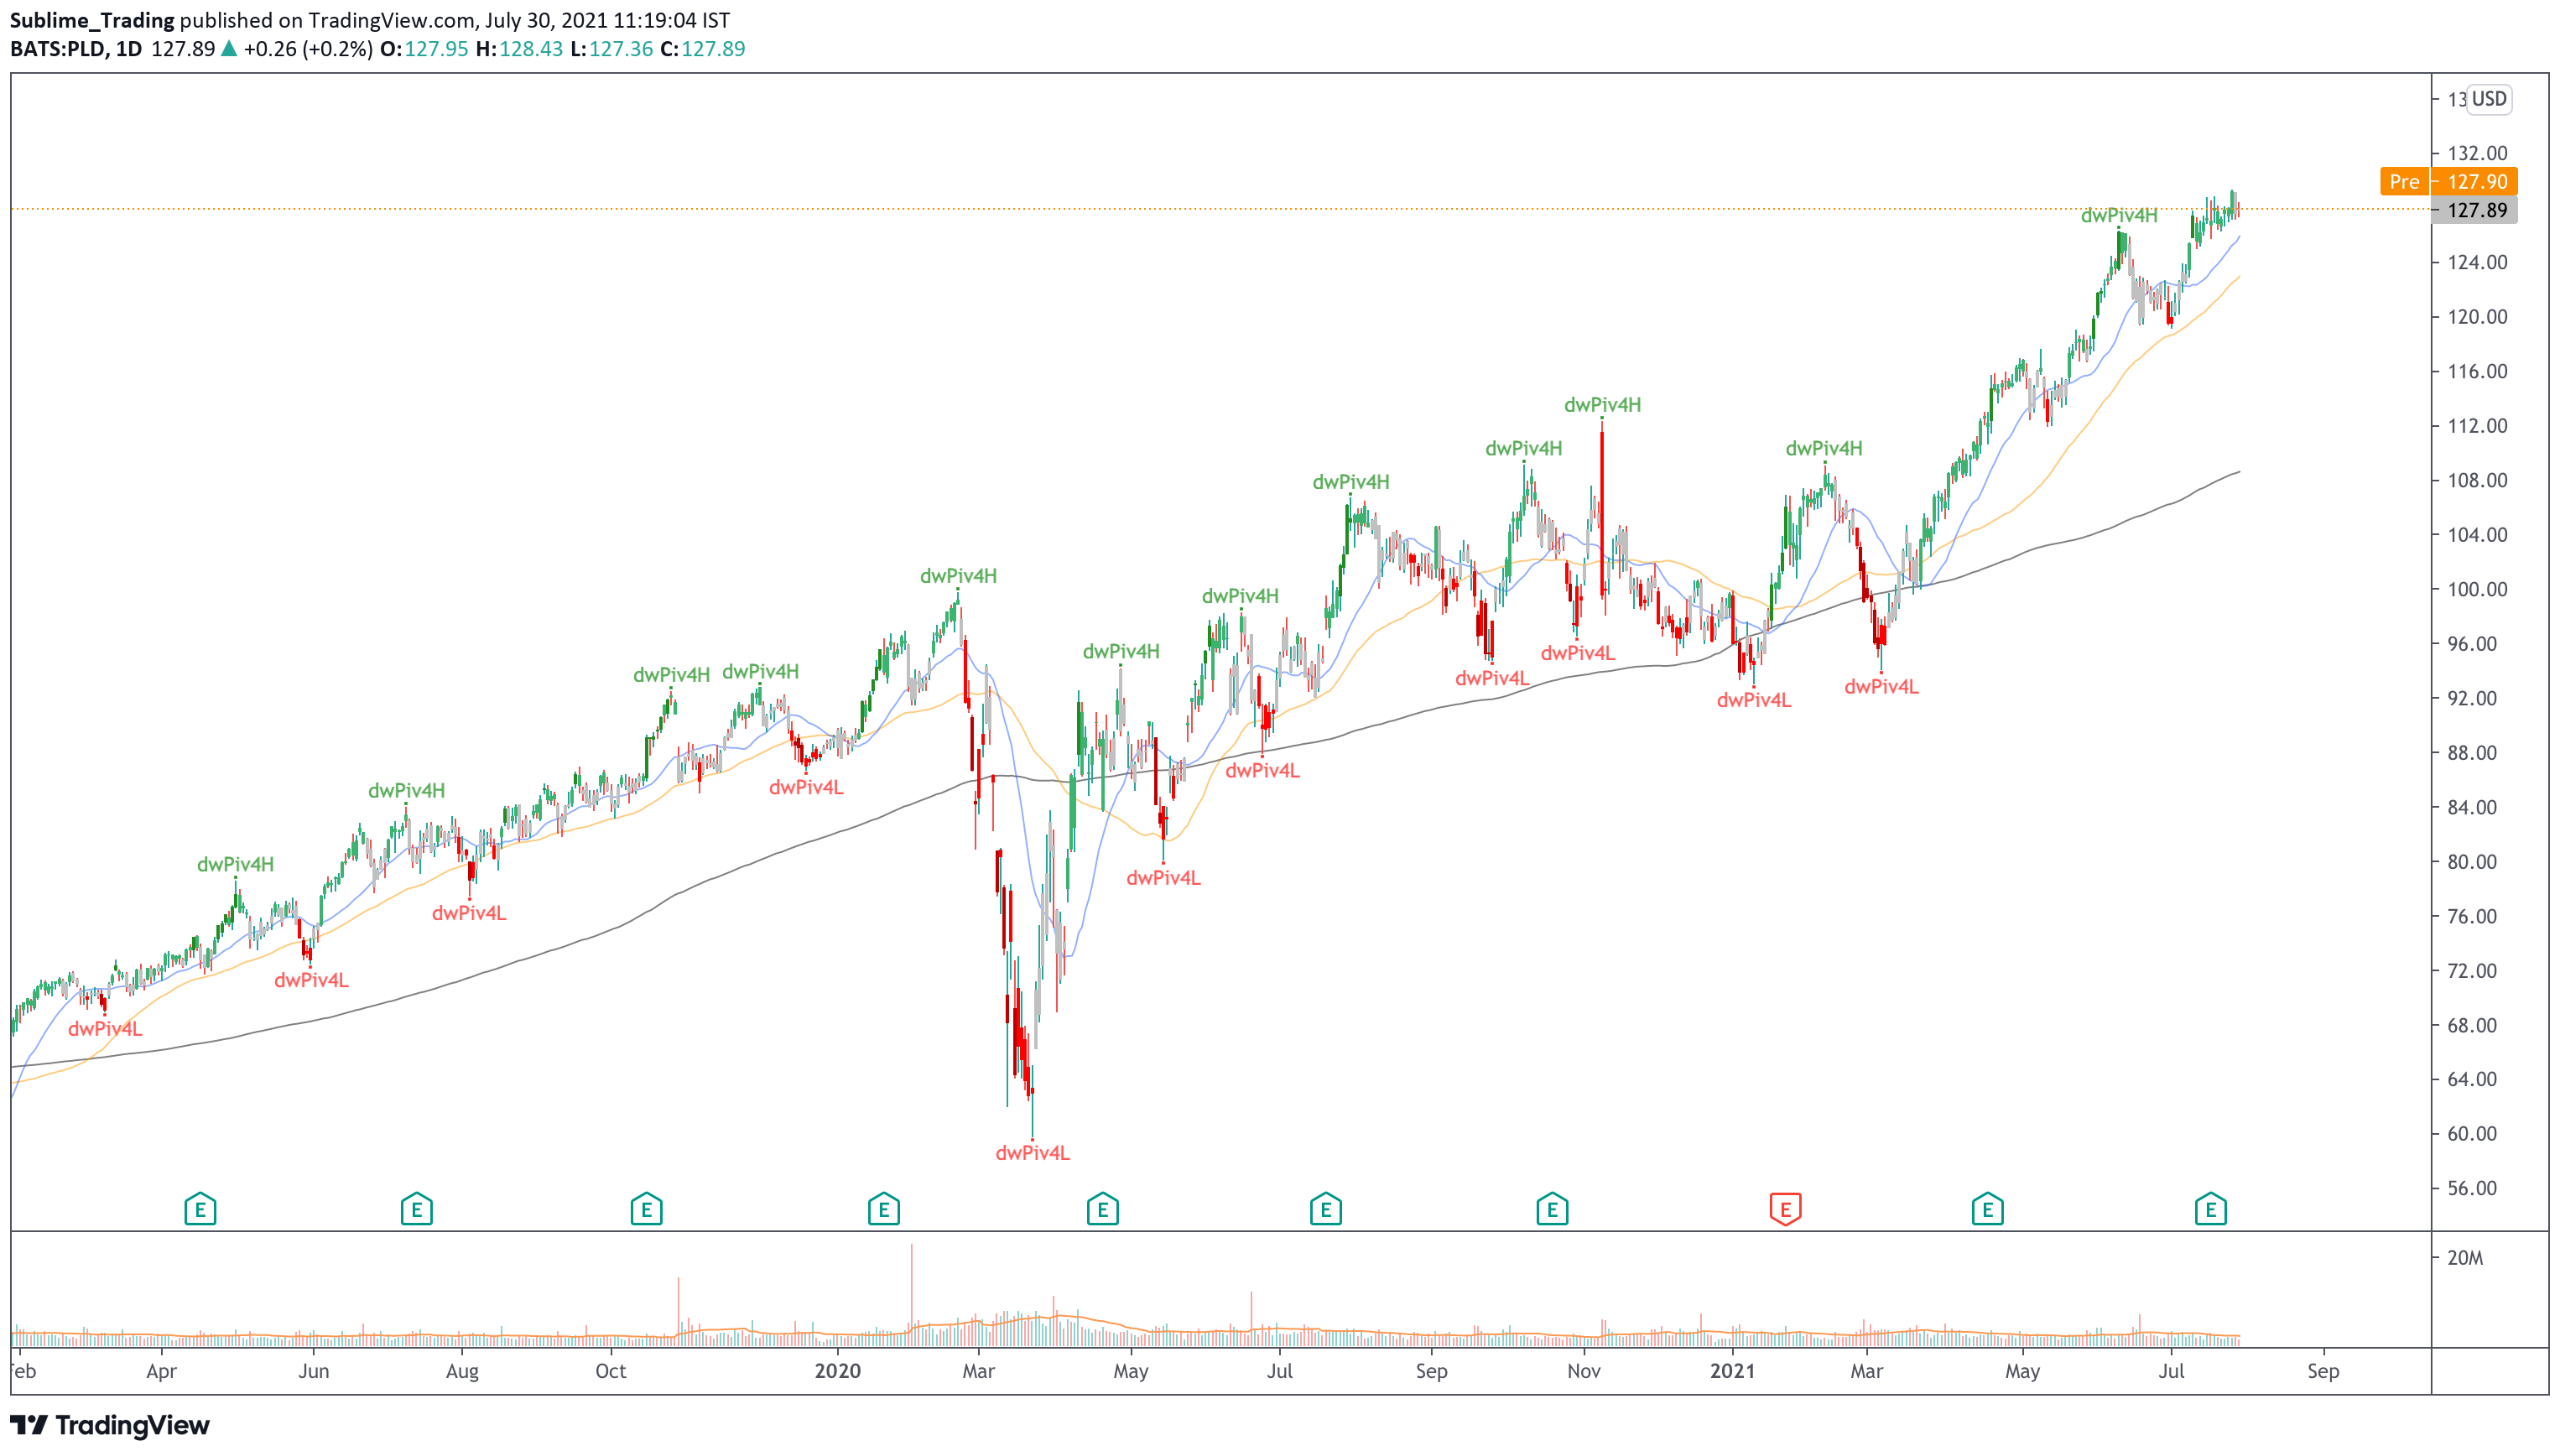
A stock that offers a history of long periods of trends and has printed a new ATH this week at $129. A very strong performance in April was followed up by indecision candles in May and June. However, July has demonstrated a trend is emerging with a 7% gain.
On the weekly timeframe, price continues to trade above the 50sma and 200sma, and the Sublime trend filter remains green.
On the daily timeframe below, price is above the 20sma, 50sma and the 200sma and the Sublime trend filter is green. Following a break above the previous major resistance level at $112, price retested this level and has since moved higher to create a new ATH. The next level of resistance is the $200 round number. Phoenix members will be watching this stock closely to see if a long-term trend develops.