


Following on from the 3.5% bullish move we saw in March, the bullish momentum has continued into April and we are so far seeing a 2.8% move to the upside. We are now anticipating a move towards last year’s high at 7689.
On the weekly timeframe, price is above the 50sma and is edging closer to the 200sma which is just under 100 points above price.
On the daily timeframe below, price is above the 20sma, the 50sma and the 200sma and Thursday’s candle saw price close above the consolidation zone resistance at 6903. If price can remain out of consolidation then we want to see a pattern of higher highs and higher lows form which will indicate a trend is in play. The FTSE is making good progress but doing so at a steady pace and as price rises, we should start to see more UK stocks breaking out.

Ashtead Group – AHT
March closed 10.6% bullish and we are already seeing a strong bullish candle for April so far which has moved up 3.9%.
The weekly timeframe sees price trading strong above the 50sma and the 200sma. The Sublime trend filter still remains green.
On the daily timeframe below, price continues to trade above the 20sma, the 50sma and the 200sma with all 3 MAs angling up confirming a bull trend. Price has predominantly been using the 20sma as support which is an indication of a linear trend. This stock has been in a consistent trend for five months so we may see a correction form but until then our members will continue to manage their positions which are performing well.

Alliance Trust – ATST
Although the candle for March closed 4.2% bullish and above last year’s high at £9.22, price had failed to break and close above the high for January 2021 at £9.32. The close above last year’s high, however, was important as it was an early indication of potential bullish moves to come. As we can see from the candle for April so far, a bullish continuation has come into fruition with a 4% move up so far.
On the weekly timeframe, the trend filter is green and price is above the 50sma and the 200sma.
The daily timeframe shows that price was previously in an area of consolidation from November 2020 to earlier this month ranging between £8.64 and £9.35. Price eventually broke out from the consolidation zone on April 6th with good momentum and is now on its way towards the £10 round number which may act as resistance. If price can clear this level then the trend will likely continue for several months.

Polar Capital Technology Trust – PCT
Following on from a volatile February and March where we experienced a decline of 17%, price has recovered from the majority of the decline and is trading up 6.5% so far this month and needs to break last year’s high at £23.70 and then the ATH at £24.46.
On the weekly timeframe, price gapped up at the start of the week after it had been using the 50sma as support for a number of weeks. The trend filter is now green following the recent bullish momentum and is also above the 200sma.
On the daily timeframe, we can see that price is above the 20sma, the 50sma and the 200sma but we need the 20sma to move above the 50sma for the moving averages to be in alignment. During the latter stages of the decline in March 2021. Price almost reached the £20 round number and has recovered really well since then, gapping up on a couple of occasions and looks on course to create new ATHs.


The 4% bullish move for March helped to give price enough momentum to move above the $4000 round number and resulting in a 2.7% bullish move so far for April. We would like to see price remain above $4000 and form a linear trend on the lower timeframe.
The weekly timeframe is strong and bullish with price trading above the 50sma and the 200sma and the Sublime trend filter continuing to show green bars.
On the daily timeframe below, price is above the 20sma, the 50sma and the 200sma and formed an impulsive move to the upside and even gapped up on Monday. This impulsive move may bring about a pullback but we have the moving averages and the $4000 round number below price to support it. We want to continue to see higher highs and higher lows going forward. With the bullish moves we are seeing in the S&P, many stocks are setting up for potential long-term uptrends and some are still trending well after months of bullish moves.

Arthur J. Gallagher – AJG
This stock did not have the best end to March as it failed to break and close above last year’s high at $129. It did, however, close bullish for that month. The momentum flowed into April and forced price to finally move above last year’s high with a 5.8% move so far. A break and close above this level by the end of the month should be followed by further moves to the upside.
On the weekly timeframe, price is trading above the 50sma and the 200sma and the Sublime trend filter is green confirming a bull trend.
On the daily timeframe below, price is trading above the 20sma, the 50sma and the 200sma and the Sublime trend filer is green. There is a cup and handle formation which is a trend continuation pattern and price has now broken out to the upside so we can expect to see further bullish moves. Price has trended well in the past with a 205% bullish trend between January 2016 and February 2020 so we want to see a similar move with the current trend as it will allow us to compound numerous times.

Extra Space Storage – EXR
March used last year’s high as support at $121 and went on to close 4.7% bullish, creating a new ATH. April has seen a bullish move of 3.3% so far and looks set to trend towards $150.
On the weekly timeframe, price is trading above the 50sma and the 200sma and the Sublime trend filter is green confirming the emergence of a trend above consolidation. Price broke above the consolidation high at $124 in February 2021 and has remained above this level since.
On the daily timeframe below, price is trading above the 20sma, the 50sma and the 200sma and the Sublime trend filter is green in alignment with the weekly timeframe. Price has started to form a trend using the 20sma as support which indicates a linear trend is developing. As price has recently broken out of consolidation, we can expect to see a strong move to the upside so positioning yourself with opportunities in this stock could pay off in the long run.

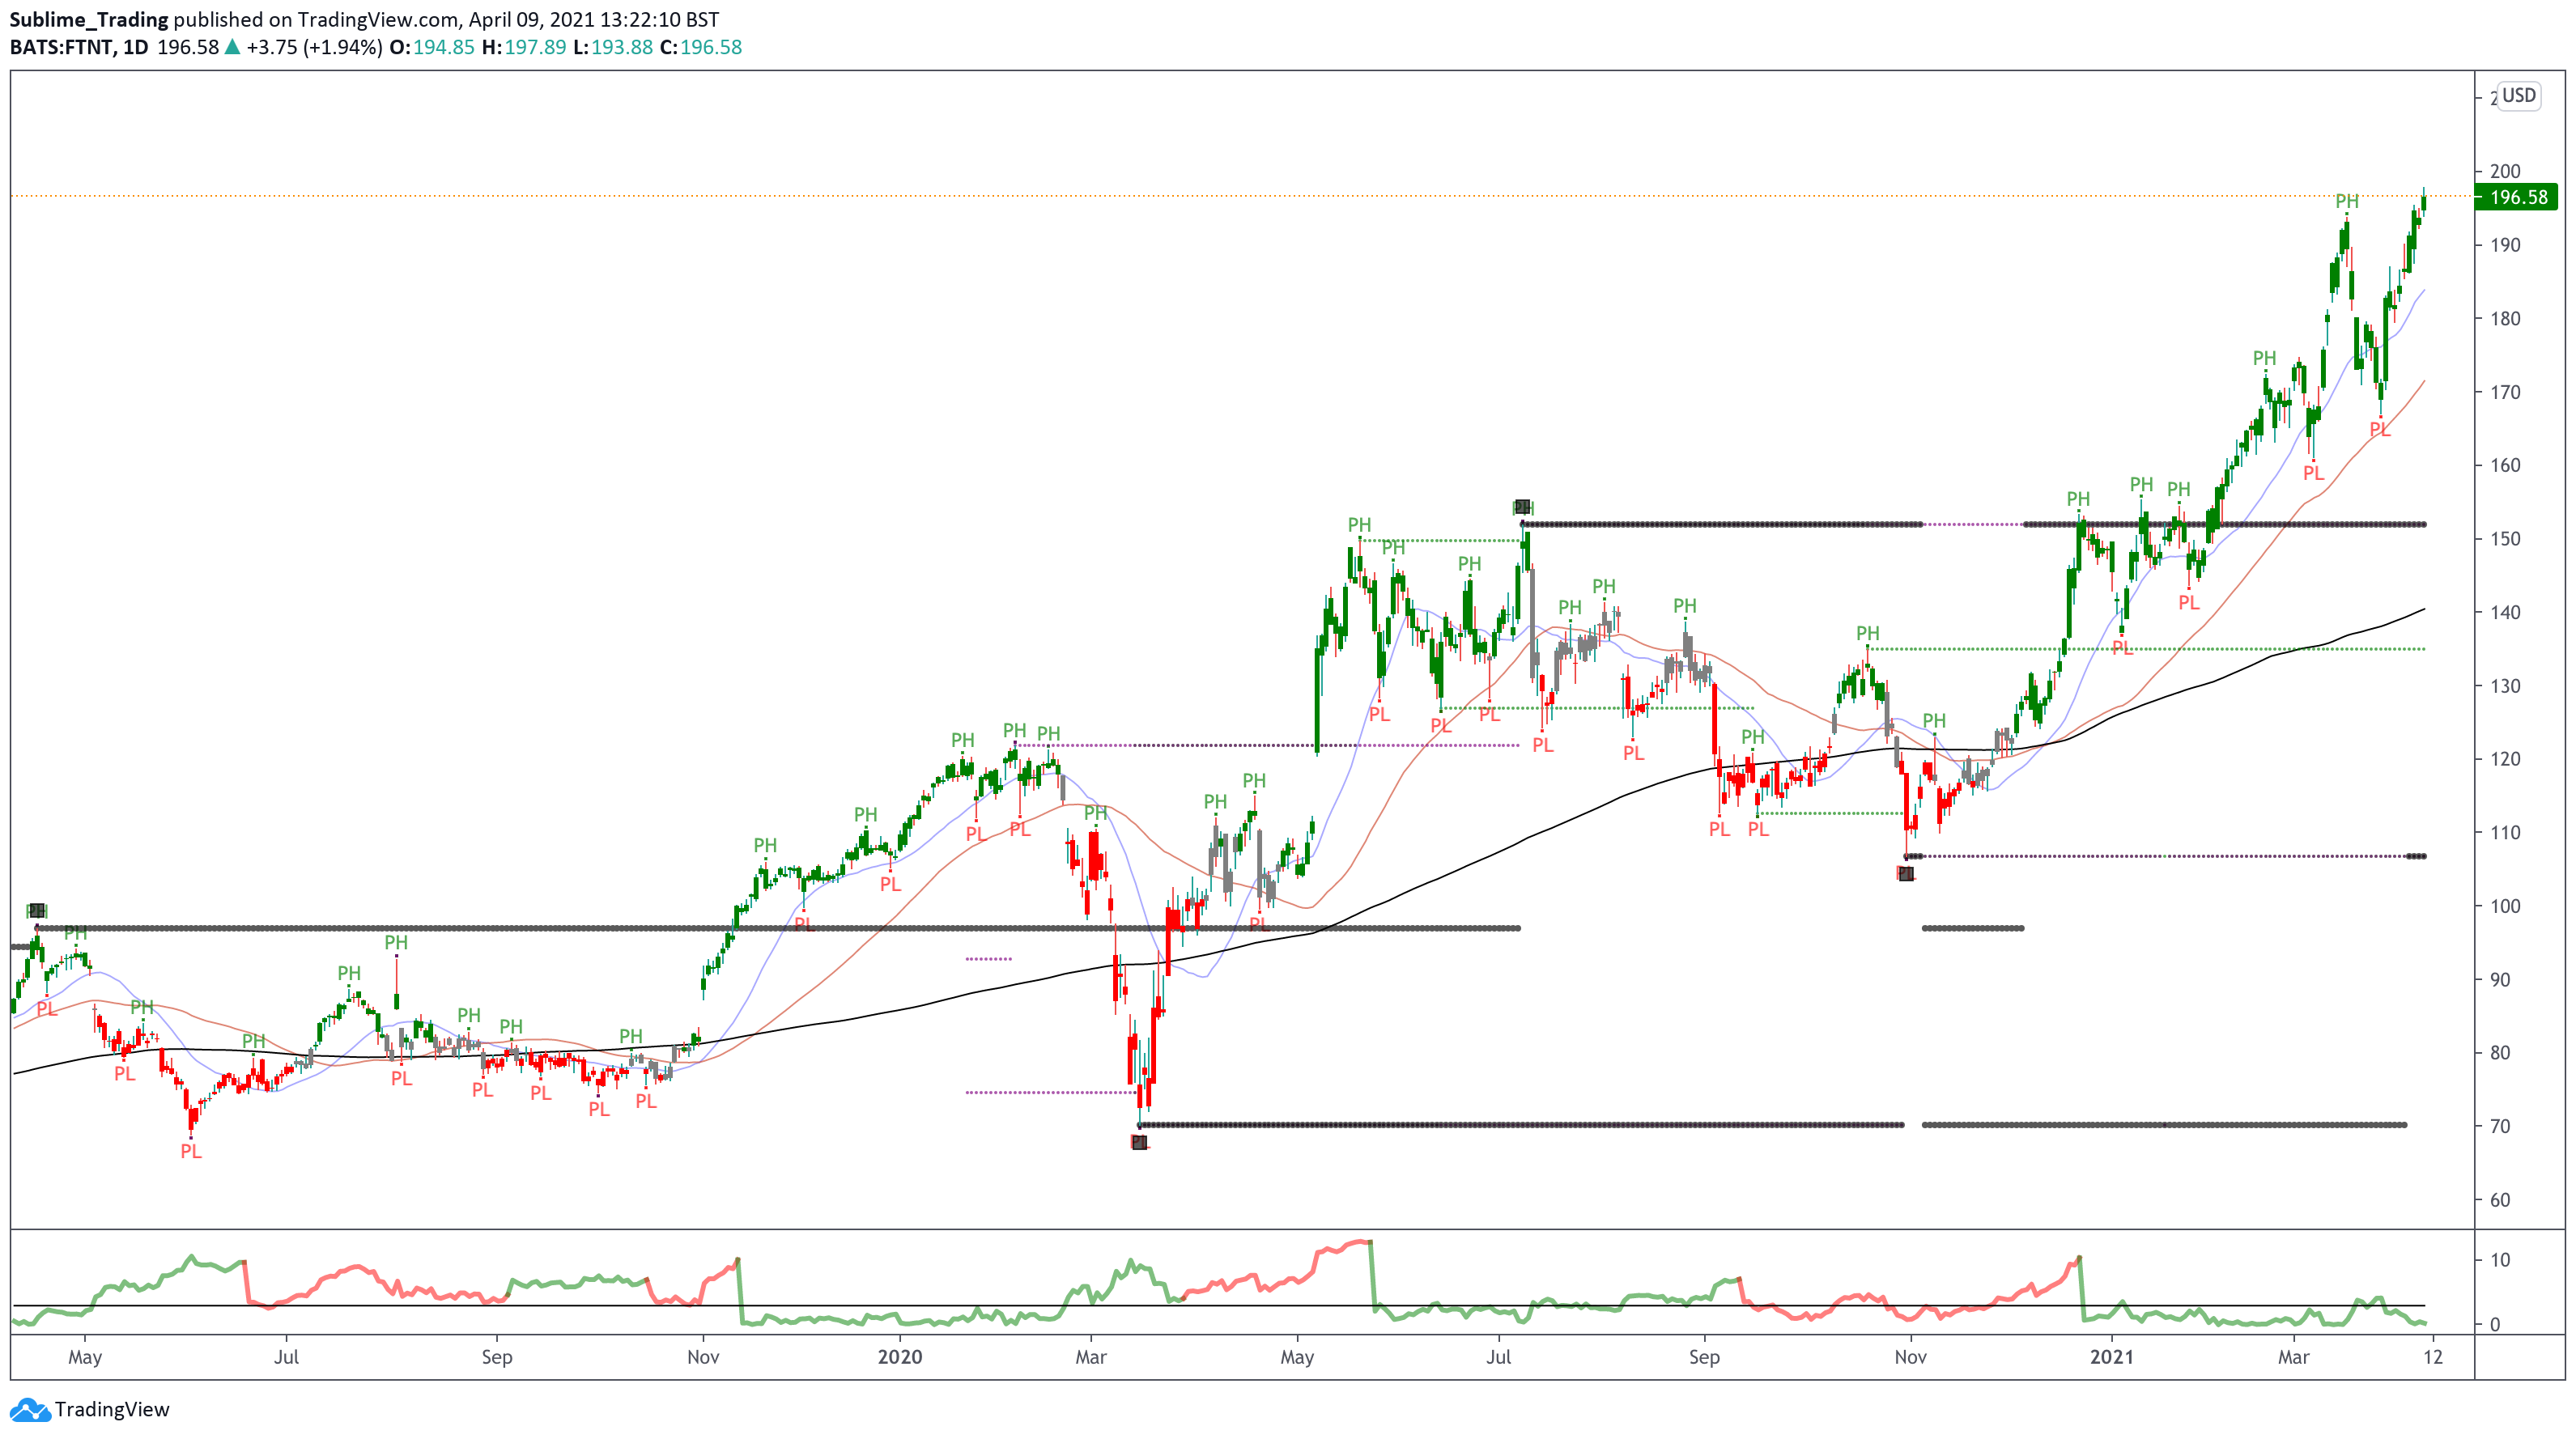
Fortinet – FTNT
Fortinet closed above last year’s high in February 2021 which is at $153. March also closed bullish and April is so far up 5.3% and heading towards the $200 round number which is a psychological level of resistance.
On the weekly timeframe, price is trading above the 50sma and the 200sma and the Sublime trend filter is green confirming the emergence of a trend.
On the daily timeframe below, price is trading above the 20sma, the 50sma and the 200sma and the Sublime trend filter is green. As price broke out of consolidation in February, which is recent, we should go on to see a strong move to the upside but that is if price makes it above $200. The zone between the 20sma and the 50sma has been acting as support and should assist price to go on to form a long-term uptrend.

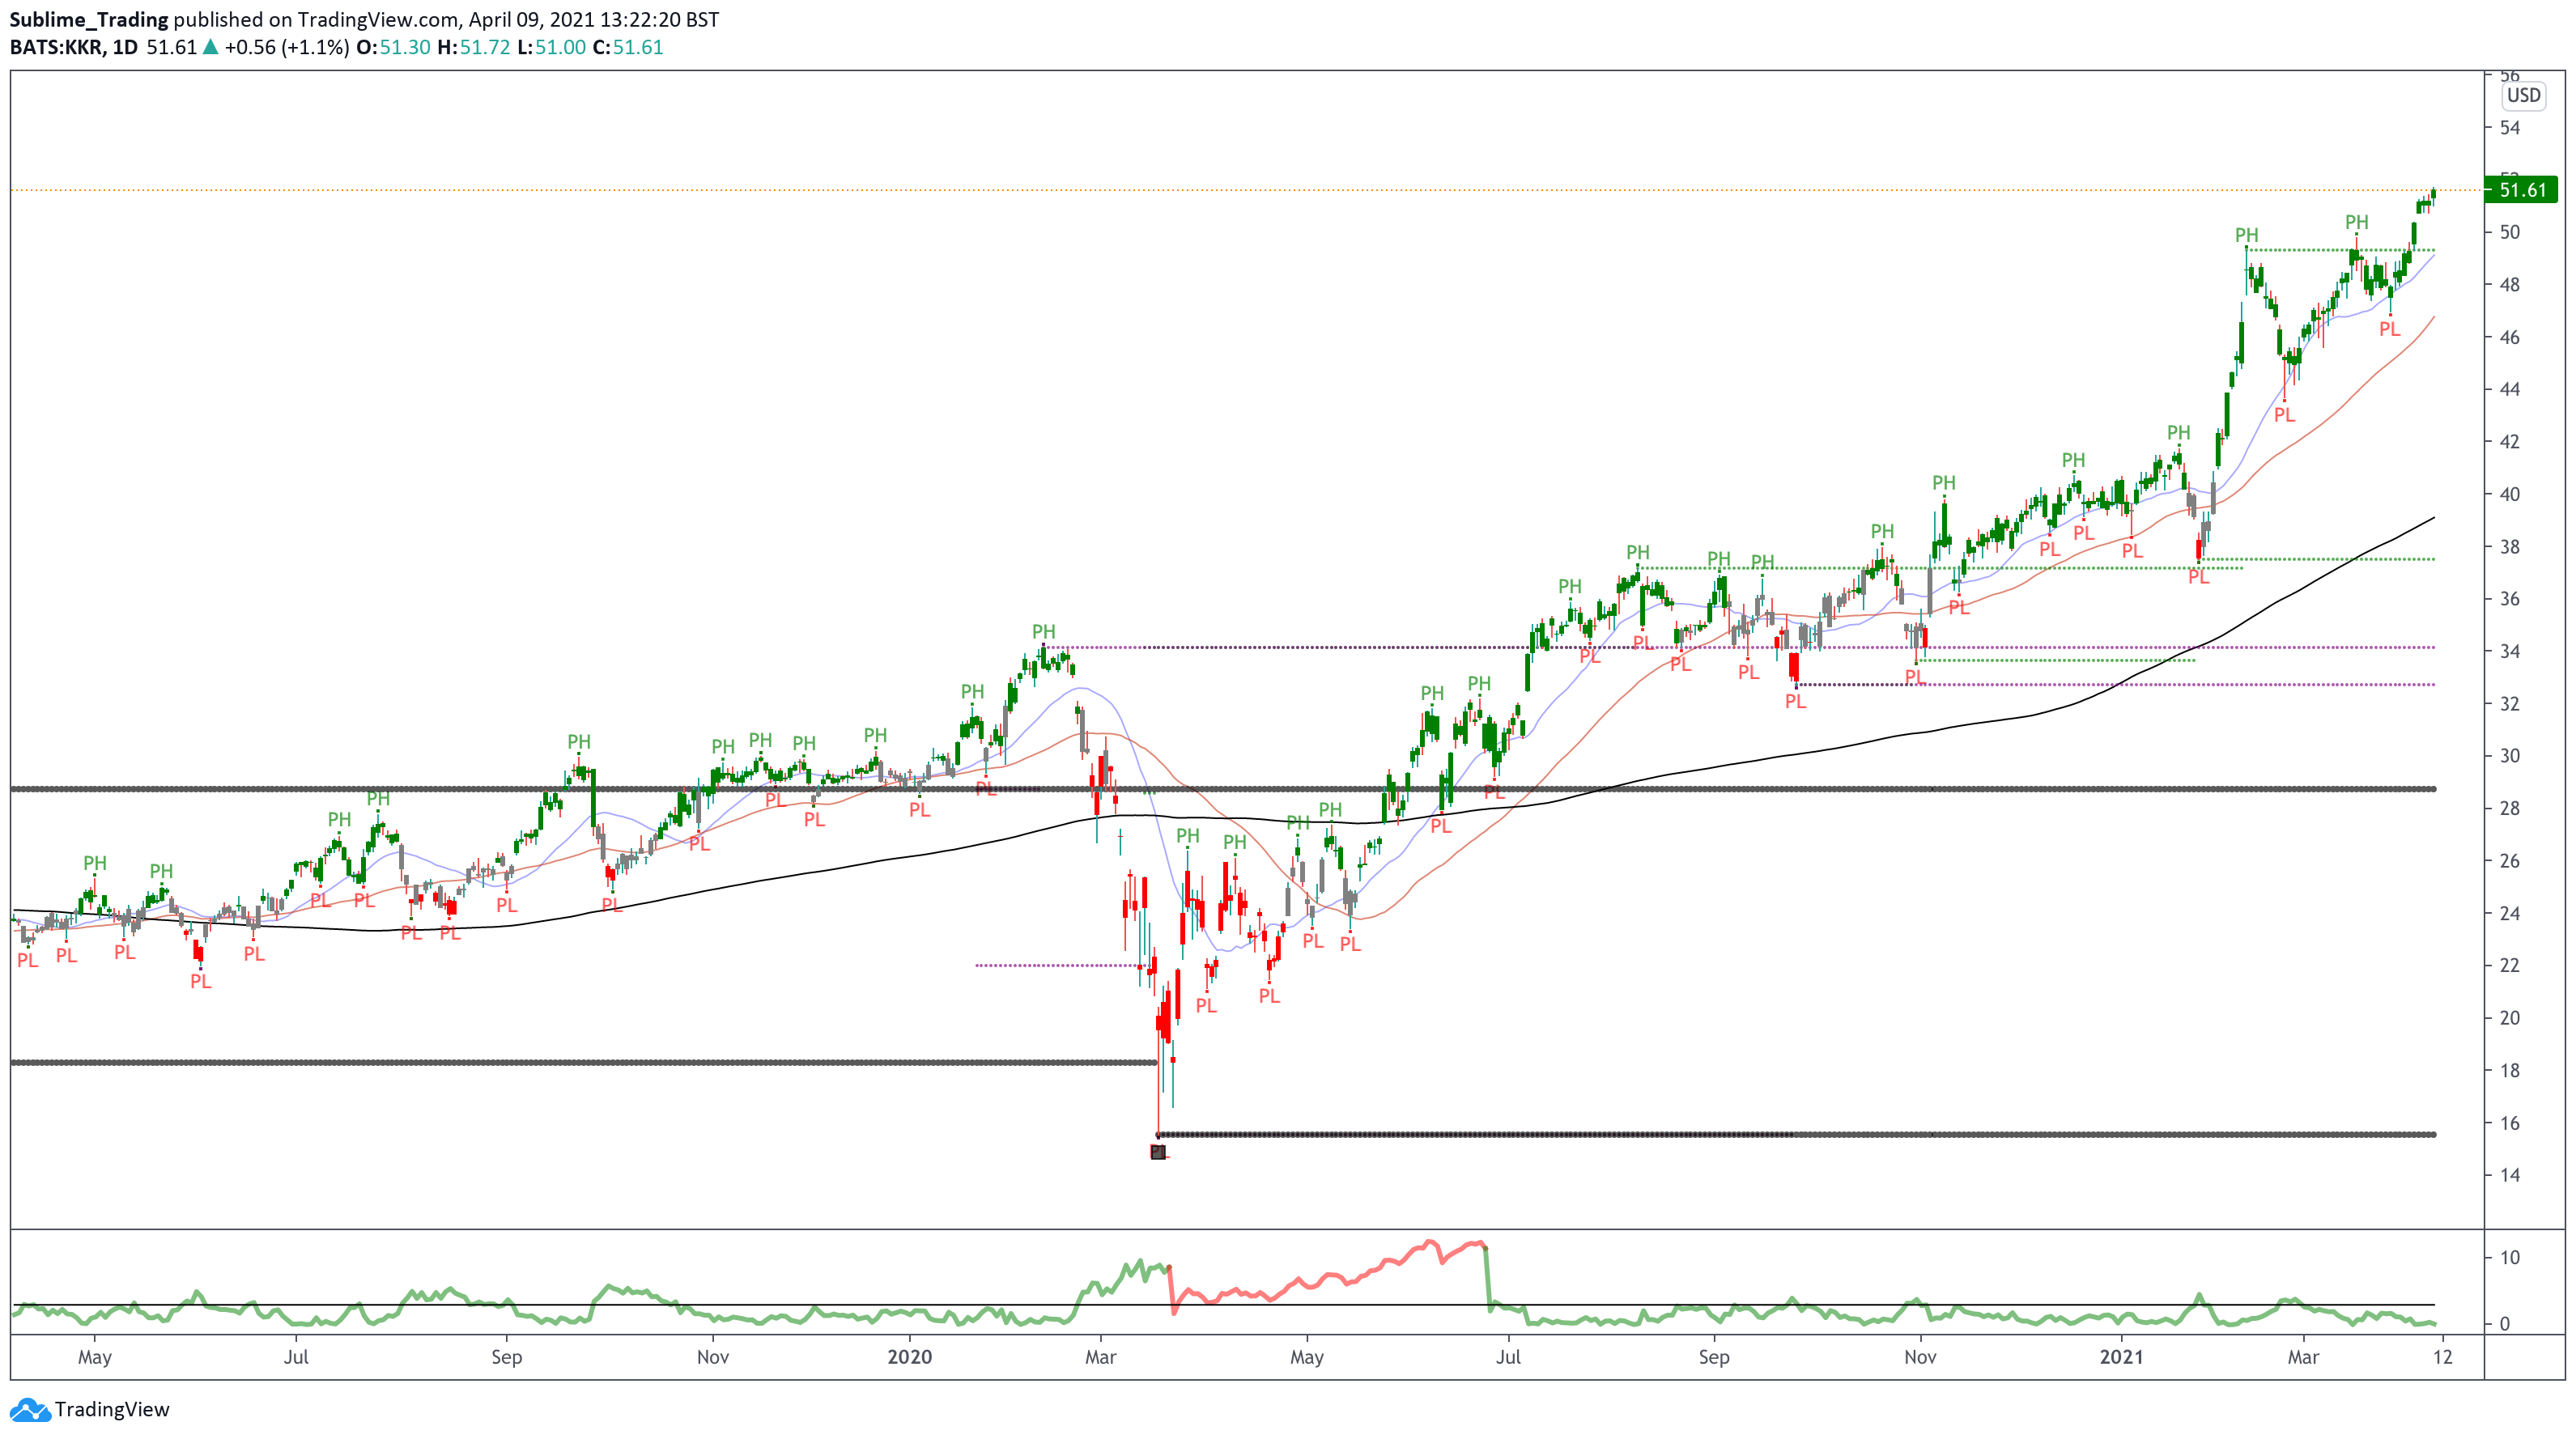
KKR & Co – KKR
Although price closed 6.1% bullish for March, it failed to close above the high for February and above the $50 round number. Despite this, price is currently trading up 4.3% this month and is also above $50.
On the weekly timeframe, price is trading above the 50sma and the 200sma and the Sublime trend filter is green and opened this week by gapping up and is likely to close bullish.
On the daily timeframe below, price is trading above the 20sma, the 50sma and the 200sma and the Sublime trend filter is green. Price recently formed a cup and handle formation which is a trend continuation pattern. Now that price has broken above this chart pattern, we can expect the bullish moves to continue. The current trend looks linear as it is using just the 20sma as support.
Nasdaq – NDAQ
January and February 2021 failed to close above last year’s high at $139 but succeeded in March with a close of 5.5%. The bullish momentum has been sustained and showing in this month’s candle with a move of 3.6% already.
On the weekly timeframe, price is trading above the 50sma and the 200sma and the Sublime trend filter is green confirming the emergence of a trend.
On the daily timeframe below, price is trading above the 20sma, the 50sma and the 200sma and the Sublime trend filter is green in alignment with the weekly timeframe. Momentum appears to be building up on this chart as price is staying above the 20sma following the sideways movement between July 2020 and March 2021. With price now above $150 we should see a trend towards the $200 round number.

Starbucks – SBUX
Momentum gathering in April with a move of around 3.5% so far to the upside taking price onto new ATHs. Price is likely to be targeting the next key level of resistance which is the $150 round number.
On the weekly timeframe, price is trading above the 50sma and the 200sma and the Sublime trend filter is green confirming a bull trend continues to emerge from the recent breakout from consolidation.
On the daily timeframe below, price is trading above the 20sma, the 50sma and the 200sma and all 3 MAs are angling up confirming a bull trend is materialising. The Sublime trend filter is green in alignment with the weekly timeframe. Positions running in the portfolio with signals shared with our Phoenix members. We will continue to monitor this and share signals as this is a stock with excellent upside potential based on past performance.

Microsoft – MSFT
A significant week for MSFT with a move of around 4.5% this week taking price out of consolidation and onto new ATHs. We have had a position in play since August of last year and jumped on this opportunity to compound and share signals with our Phoenix members.
On the weekly timeframe, price is trading above the 50sma and the 200sma and the Sublime trend filter continues to print green bars confirming the bull trend.
On the daily timeframe below, we can clearly see the sideways market price has been in since last year confirmed with the Sublime trend filter alternating between green, grey and red. The MAs are now also aligned with the 20sma moving back above the 50sma this week and both printing above the 200sma. It is now a waiting game to see if the breakout of this week leads to the emergence of a trend that pushes on towards $300 and beyond.