

For the past three months price has struggled to break above the pivot high from 2015 at 7124. Whilst price is supported by the weekly 200sma, daily 50sma and 7000 round number. In turn, this has created a tight trading range for the index.
The Sublime trend filter continues to remain green on the weekly timeframe, with price using the 200sma as support.
On the daily timeframe below, we can see that since mid-May price has been using the 50sma as support. This week price has pulled back to the low of the recent range, being the pivot low from 13 May. Price subsequently bounced off this level and moved back up towards the 7,000 round number. The Sublime trend filter is alternating between grey and red, indicating price is in a period of indecision. However, our bias overall remains bullish, and we continue to look for stocks outperforming the index.
A trending stock we have repeatedly discussed in this newsletter and with our Phoenix community. Following May’s strong performance that added to the long term trend, June was an indecision candle. After retesting the £50 round number, strength has returned in July with a 6% increase to date.
On the weekly timeframe, the Sublime trend filter is green, and price is above the 50sma and 200sma.
On the daily timeframe below, the Sublime trend filter is also green, and price continues to trade above the 50sma and the 200sma. This week, price pulled back and retested 50sma. Price subsequently bounced off the moving average and on Thursday created a new ATH at £57.62. With a breakout and trend continuation, price is headed towards the £100 major round number. We will continue to update our Phoenix members on this high-performing stock.
A stock we have been in since last year, this week price created an ATH at £78.76. July’s performance to date has continued the bullish trend with a gain exceeding 7%. This follows June’s increase of 5.4%. Year to date price has increased by an impressive 19%.
On the weekly timeframe, price is trading above the 50sma and 200sma, and the Sublime trend filter is green. Since the breakout from consolidation in May, price retested the wPiv21 and £70 round number, which has acted as a strong area of support.
On the daily timeframe below, price is above the 20sma, 50sma and 200sma, and the Sublime trend filter is green. The patience we have previously discussed is paying off, as price is displaying evidence of a linear trend. We will continue to share signals with our Phoenix members, particularly if we see such a trend develop towards the next round number at £100.
A stock with a mixed history. July is displaying an indecision candle as price is struggling to form a clean break above the mPiv9 at £25.50. This follows indecision candles in May and June.
On the weekly timeframe, price is above the 50sma and 200sma, and the Sublime trend filter is green.
On the daily timeframe below, price this week retreated to retest the mPiv9 level and daily 50sma. This strong zone of support has held and price has subsequently moved higher. The Sublime trend filter is alternating between grey and green. We will continue to monitor this stock, and update Phoenix members if a linear trend develops.

July’s candle is currently displaying bullish momentum, with a 2% gain to date. Should this performance continue to the end of the month, July will be the sixth consecutive month of gains. Price created an ATH last week at $4,393.
On the weekly timeframe, price continues to trade above the 50sma and 200sma, and the Sublime trend filter remains green.
On the daily timeframe below, price is above the 20sma, 50sma and 200sma. This week the Sublime trend filter alternated between grey and green as price pulled back to retest the 50sma. The bulls remain in control of the S&P, and we continue to look for stocks that are outperforming the index.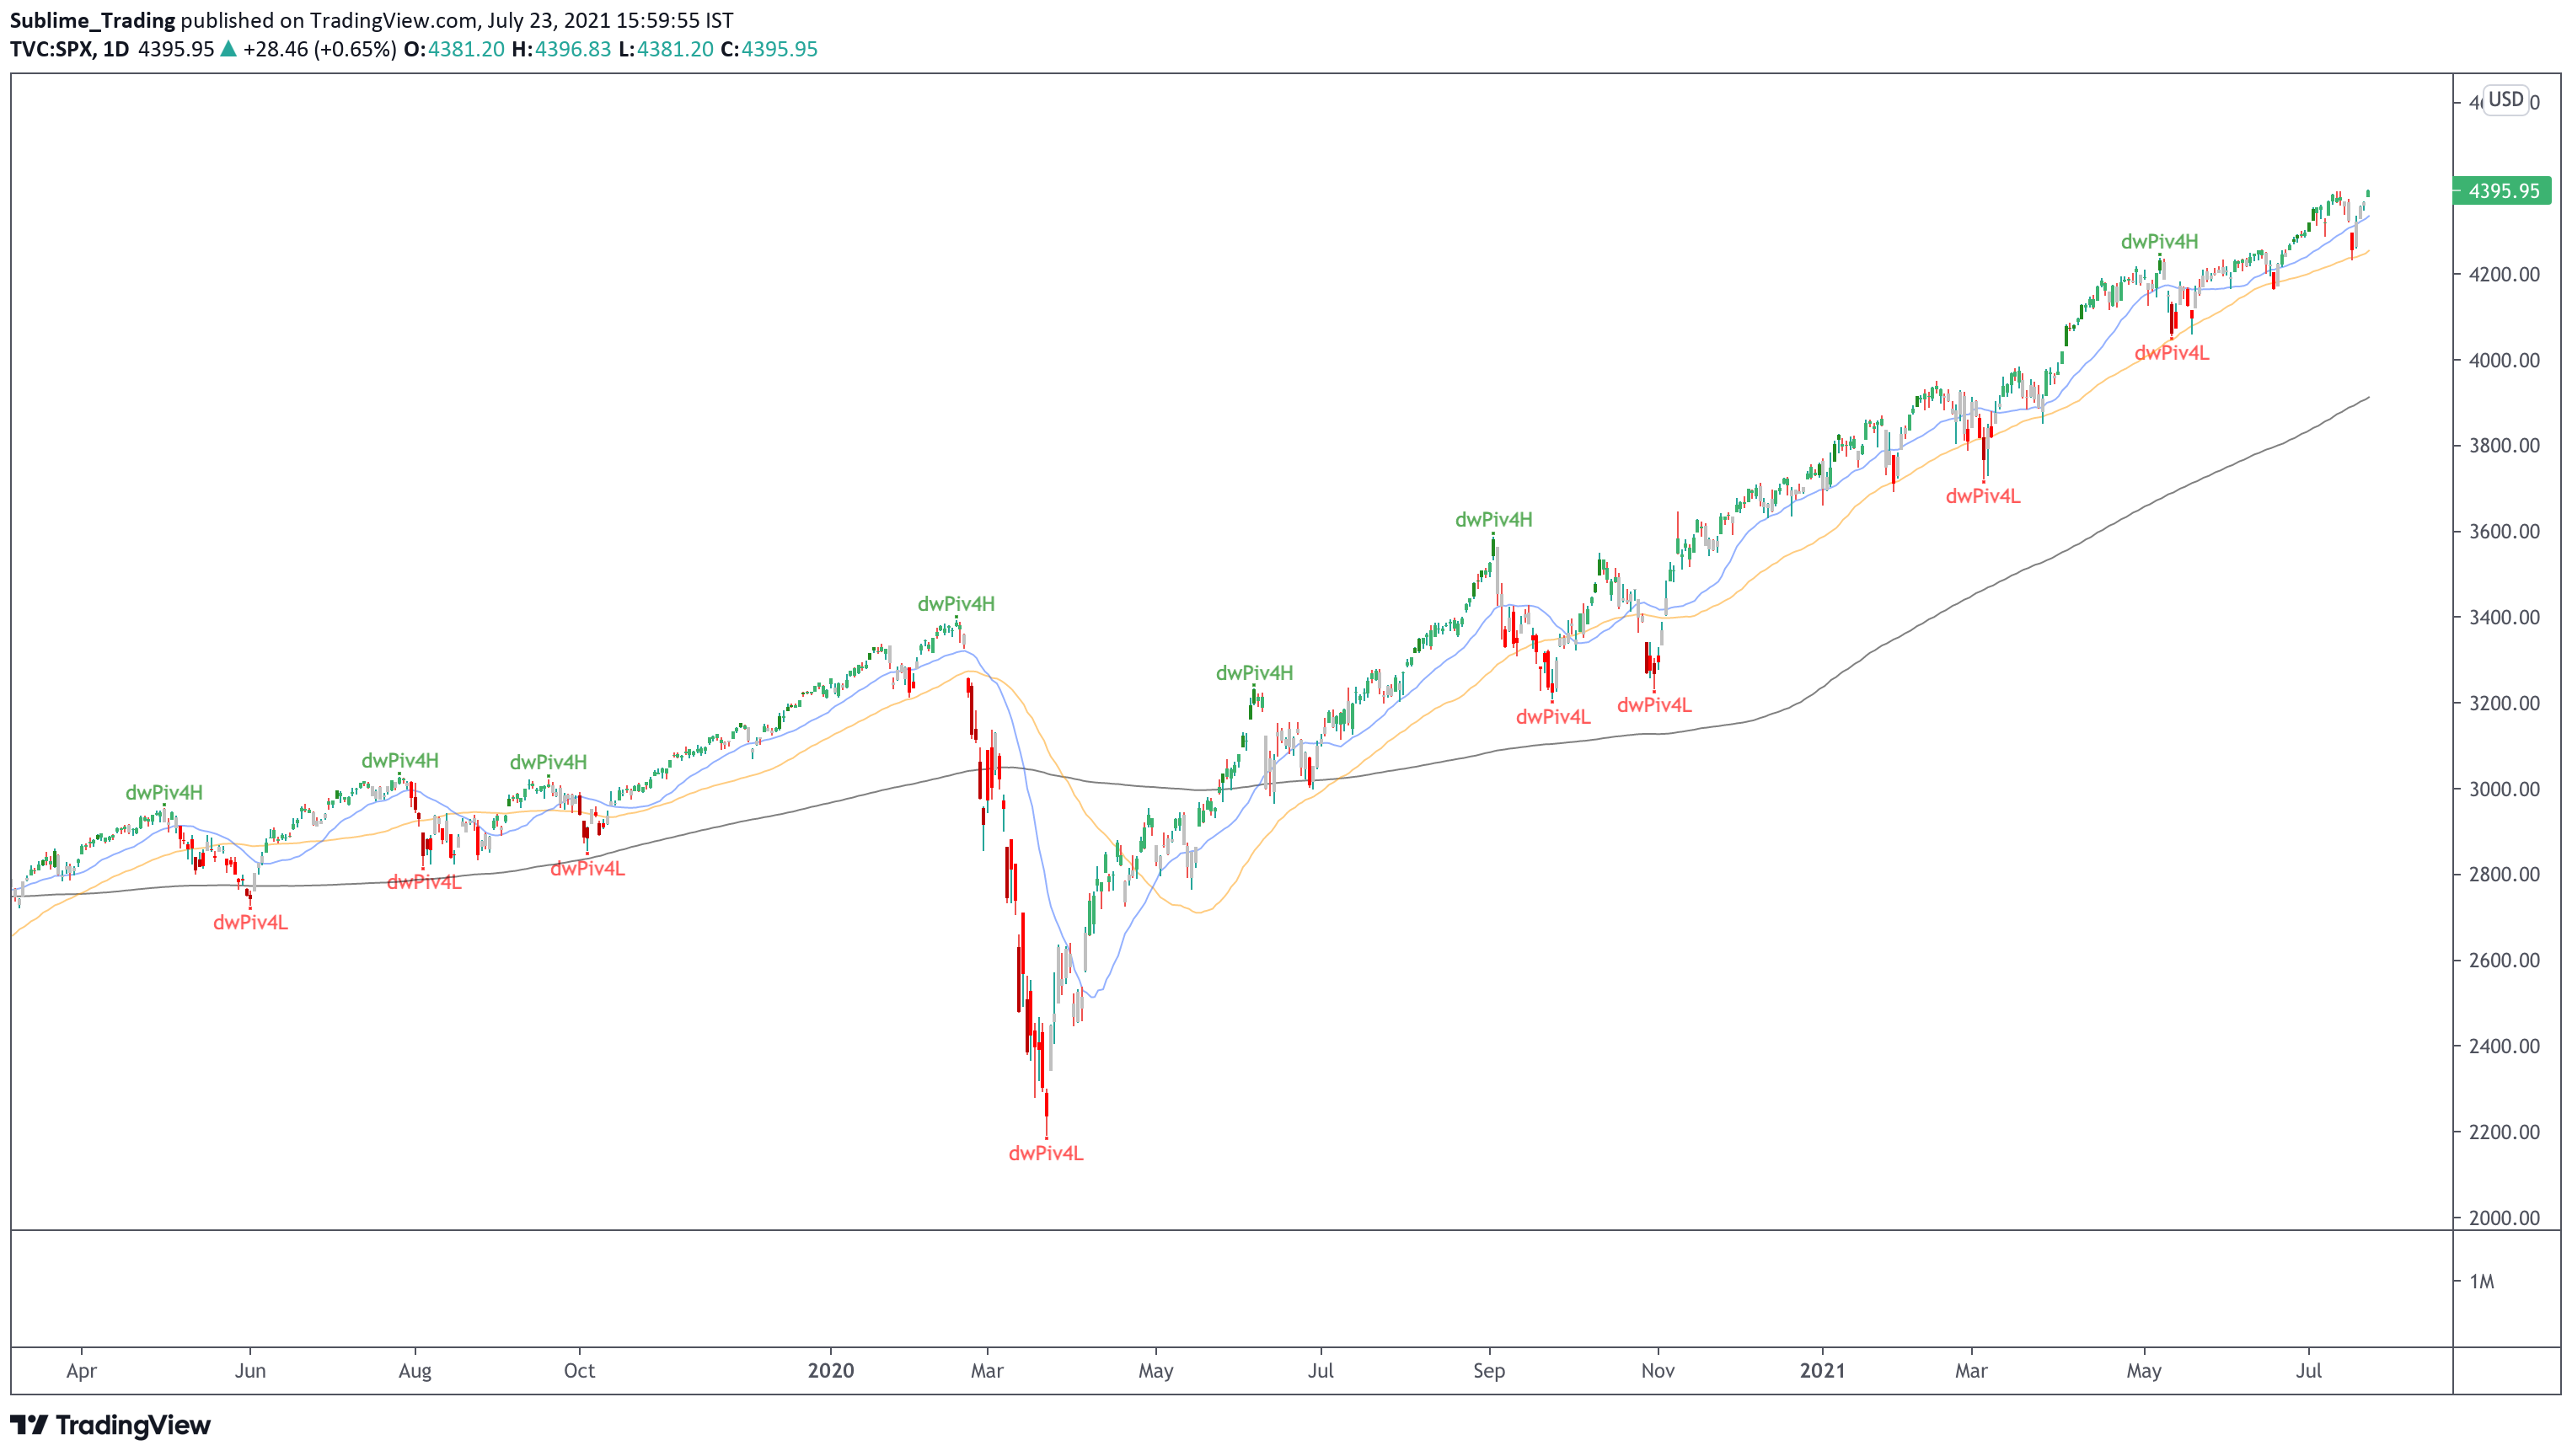
A stock with a short and mixed history. Following the initial float in April 2018 price was in a period of consolidation. From mid-2019 price created an impulsive move higher. Price then went into consolidation between the $200 and $300 round numbers. June’s candle was bullish with a 38% gain, and in July this momentum has continued with a further 10% gain.
On the weekly timeframe, price is trading above both the 50sma and 200sma, whilst the Sublime trend filter remains green.
On the daily timeframe below, price initially failed to break above the mPiv9 at $290, but this week price has broken out, whilst also going on to clear the $300 round number. Price is now trading above the 20sma, 50sma and 200sma, and the Sublime trend filter is green. We will monitor this stock to see how price reacts to the $300 round number and new ATH. We will update our Phoenix community if any high probability opportunities emerge.
The history of this stock has great appeal. A bullish 27% move in April has been followed by some indecision, which was to be expected as price paused before its next move. July is currently displaying a bullish candle, with an increase of 4.3% to date.
On the weekly timeframe, price is trading above the 50sma, and the 200sma and the Sublime trend filter is green, confirming a bull trend in play.
On the daily timeframe below, price is trading above the 20sma, 50sma and 200sma. The Sublime trend filter is also green. Following the gap up from the previous earnings, price has continued higher, using the zonal area between MAs as support. We will continue to share signals with our Phoenix community, as price works its way towards the next level of resistance, being the $300 round number.
This stock continues to go from strength to strength. The current impulsive trend has continued throughout July, with a 14% increase to date, resulting in an ATH this week at $271.
On the weekly timeframe, price continues to trade above the 50sma and 200sma, and the Sublime trend filter remains green.
On the daily timeframe below, since price closed above the wPiv21 level in February this year, price has used the area between the 20sma and 50sma as support. Price remains above the MAs and there is room for the trend to continue before the next area of resistance, being the $300 round number. With earnings due on 29 July we will monitor this stock and let price dictate our next move. Phoenix members will be looking to add compounds to existing positions if this strong trend continues.
Price is currently in a strong trend. Since breaking above last year’s high at $167 in February this year, price has since gone on to break above the $200 psychological resistance level. This week’s earnings results have continued the trend, with July’s candle gaining over 19%.
The weekly timeframe is looking very bullish. The Sublime trend filter is green and price is above the 50sma and 200sma.
On the daily timeframe below, price has gapped up following earnings. We will now apply patience as we wait to see if price will continue higher or fill the gap. Price is above the 20sma, 50sma and 200sma and the Sublime trend filter is green. Price has been trending well since November 2020, and we can potentially see this trend lasting for several more months. We will continue to update our Phoenix members of high probability entries as they emerge.
Another stock with a short and mixed history. Following its float in February 2017, price was initially in a period of consolidation. From April 2019 price created an impulsive move higher. Price there suffered a strong reversal due to the pandemic, falling to $16. Price has since demonstrated strength and broke above the mPiv9 in April 2021. Since then price has gained 14%, including a gain of 7% in July.
On the weekly timeframe, price is trading above both the 50sma and 200sma, and the Sublime trend filter remains green.
On the daily timeframe below, price is trading above the 20sma, 50sma and 200sma, and the Sublime trend filter is green. The MAs are neatly aligned, indicating a linear trend. With earnings approaching we will monitor this stock to see how price reacts. We will update our Phoenix community if any high probability opportunities emerge.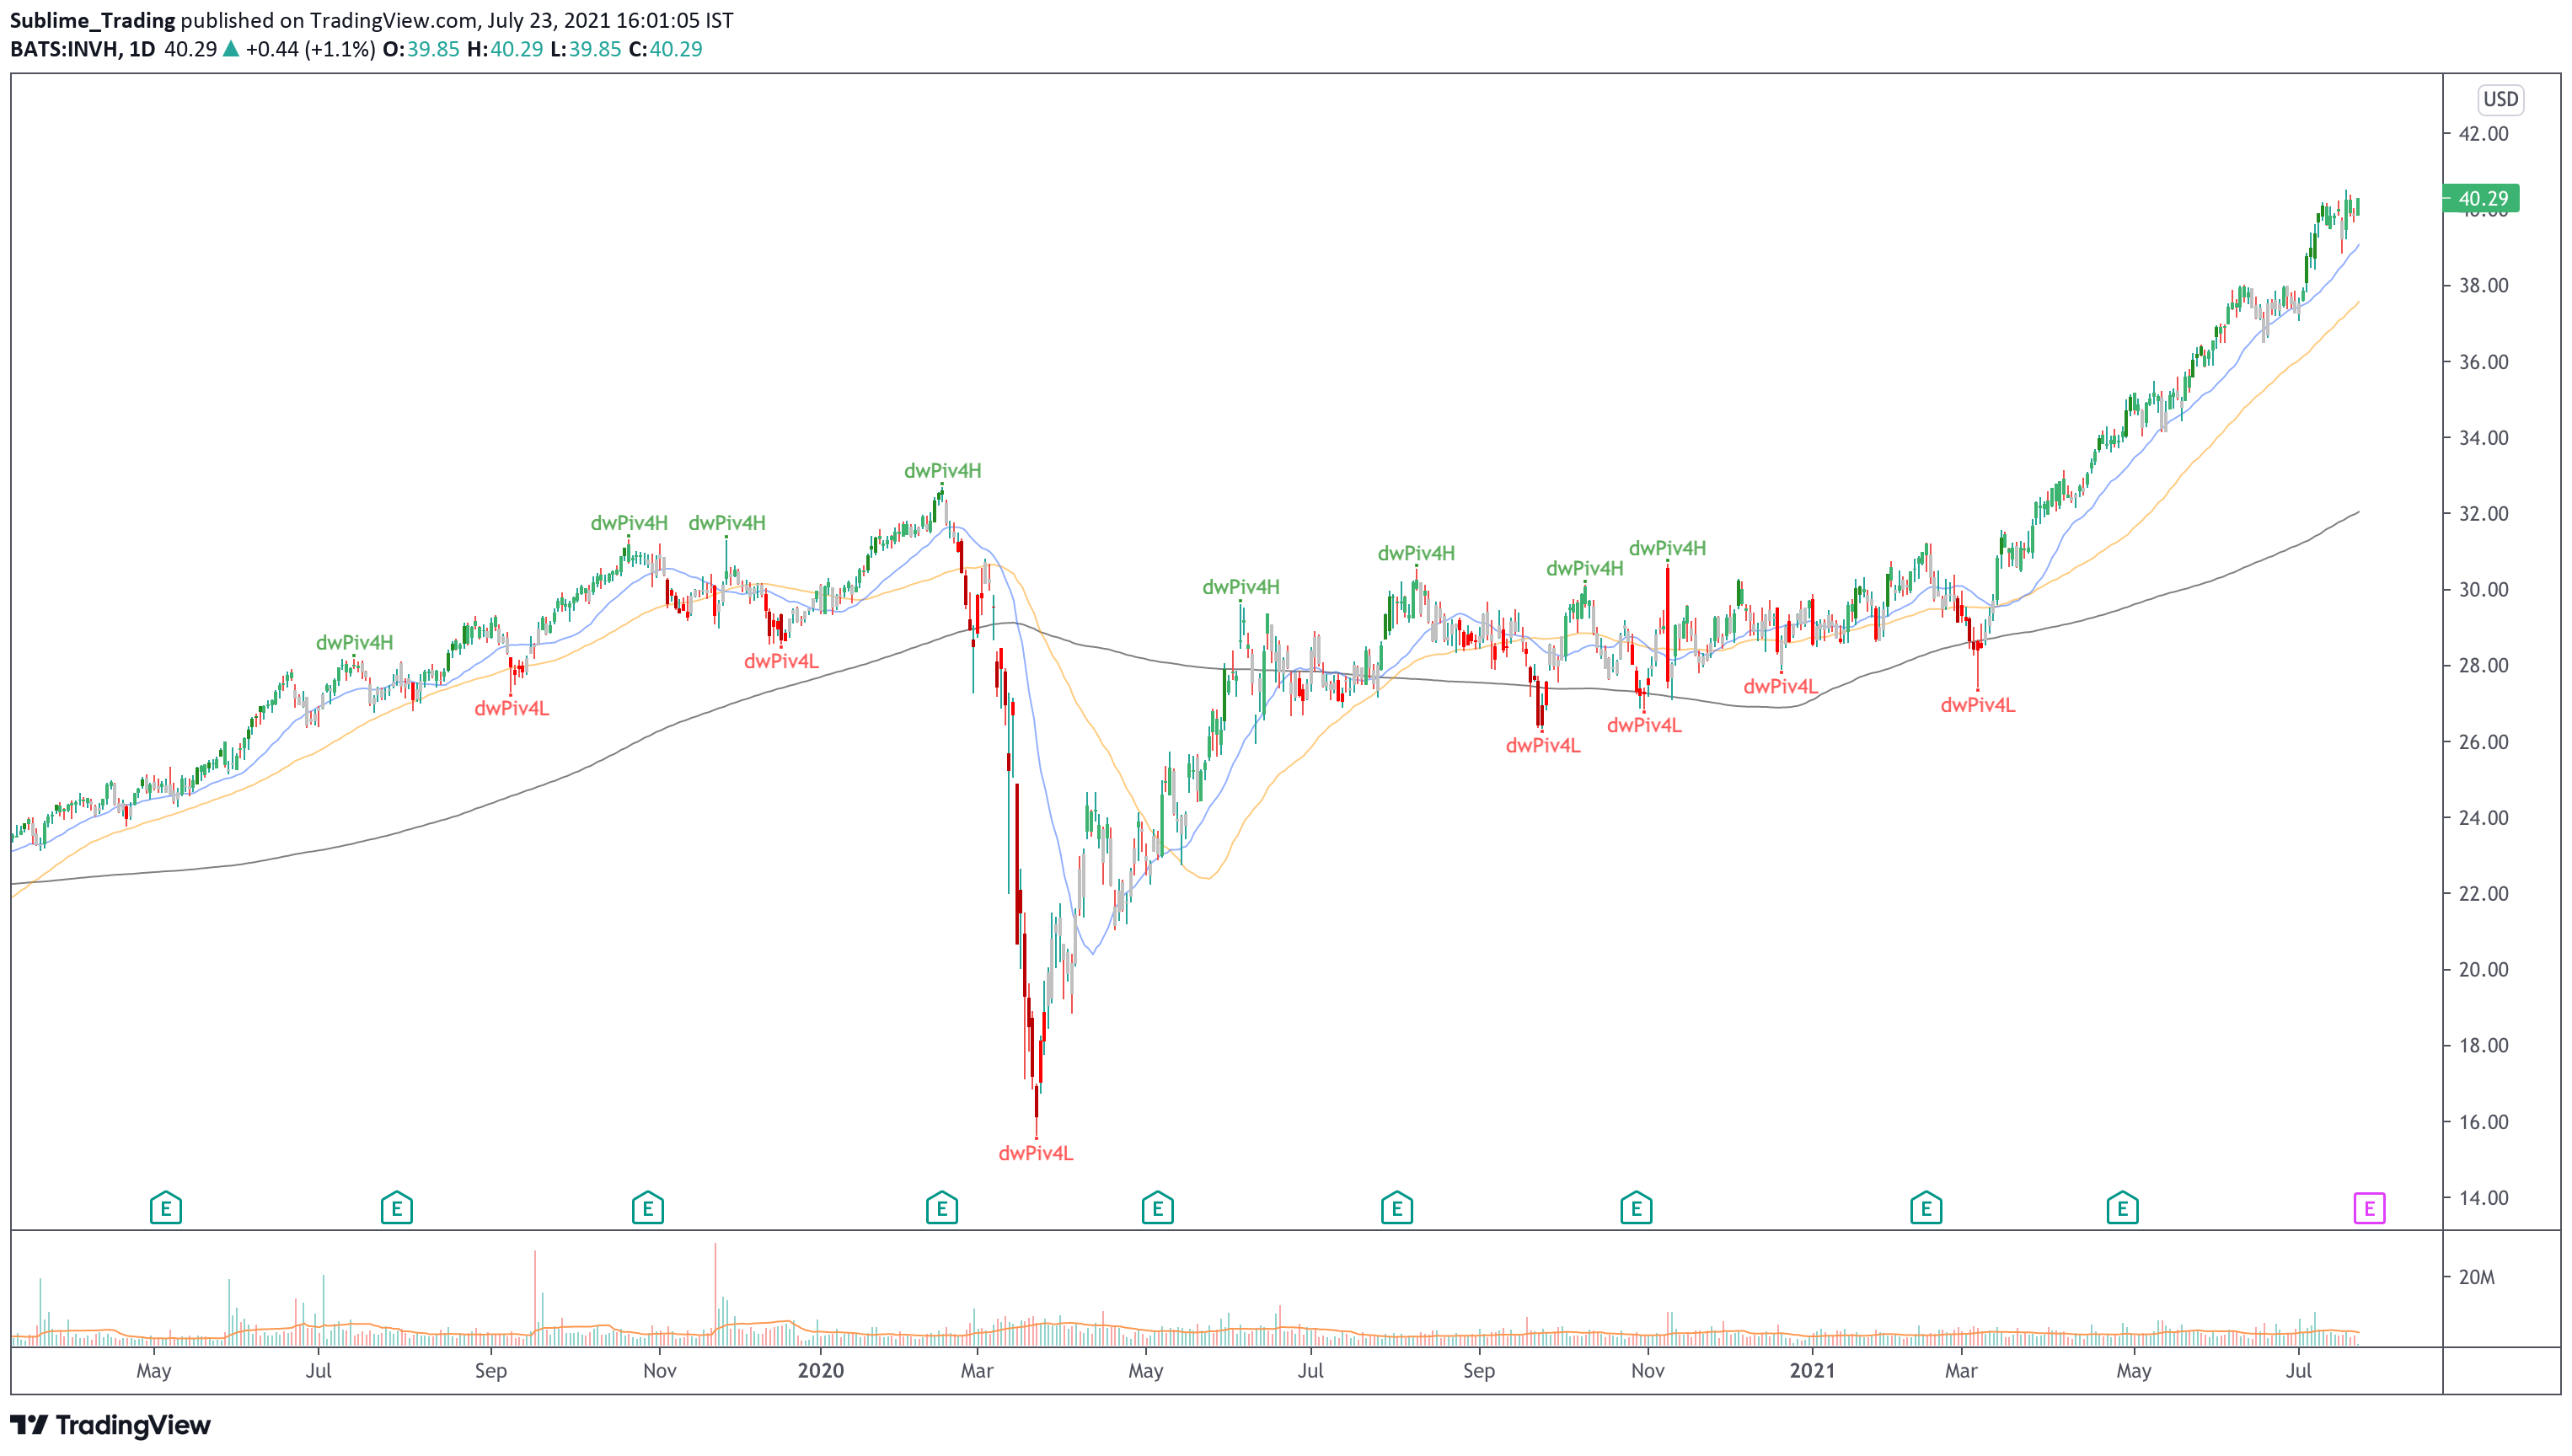

A stock with a mixed history including long periods of consolidation, over the past year price has formed an impulsive and bullish move. July’s candle has continued the pattern of recent months with a 6% increase to date, resulting in an ATH this week at $258.
On the weekly timeframe, the Sublime trend filter is green, and price is above the 50sma and 200sma.
On the daily timeframe below, price is above the 20sma, 50sma and 200sma and the Sublime trend filter is also green. This year, between January to March, price was in a period of consolidation below the $200 round number. Once price broke out above this level, price has used the 20sma as support. Price has plenty of space to continue its trend before the next round number at $300. Phoenix members have a position in this stock and will look to compound as opportunities present themselves.
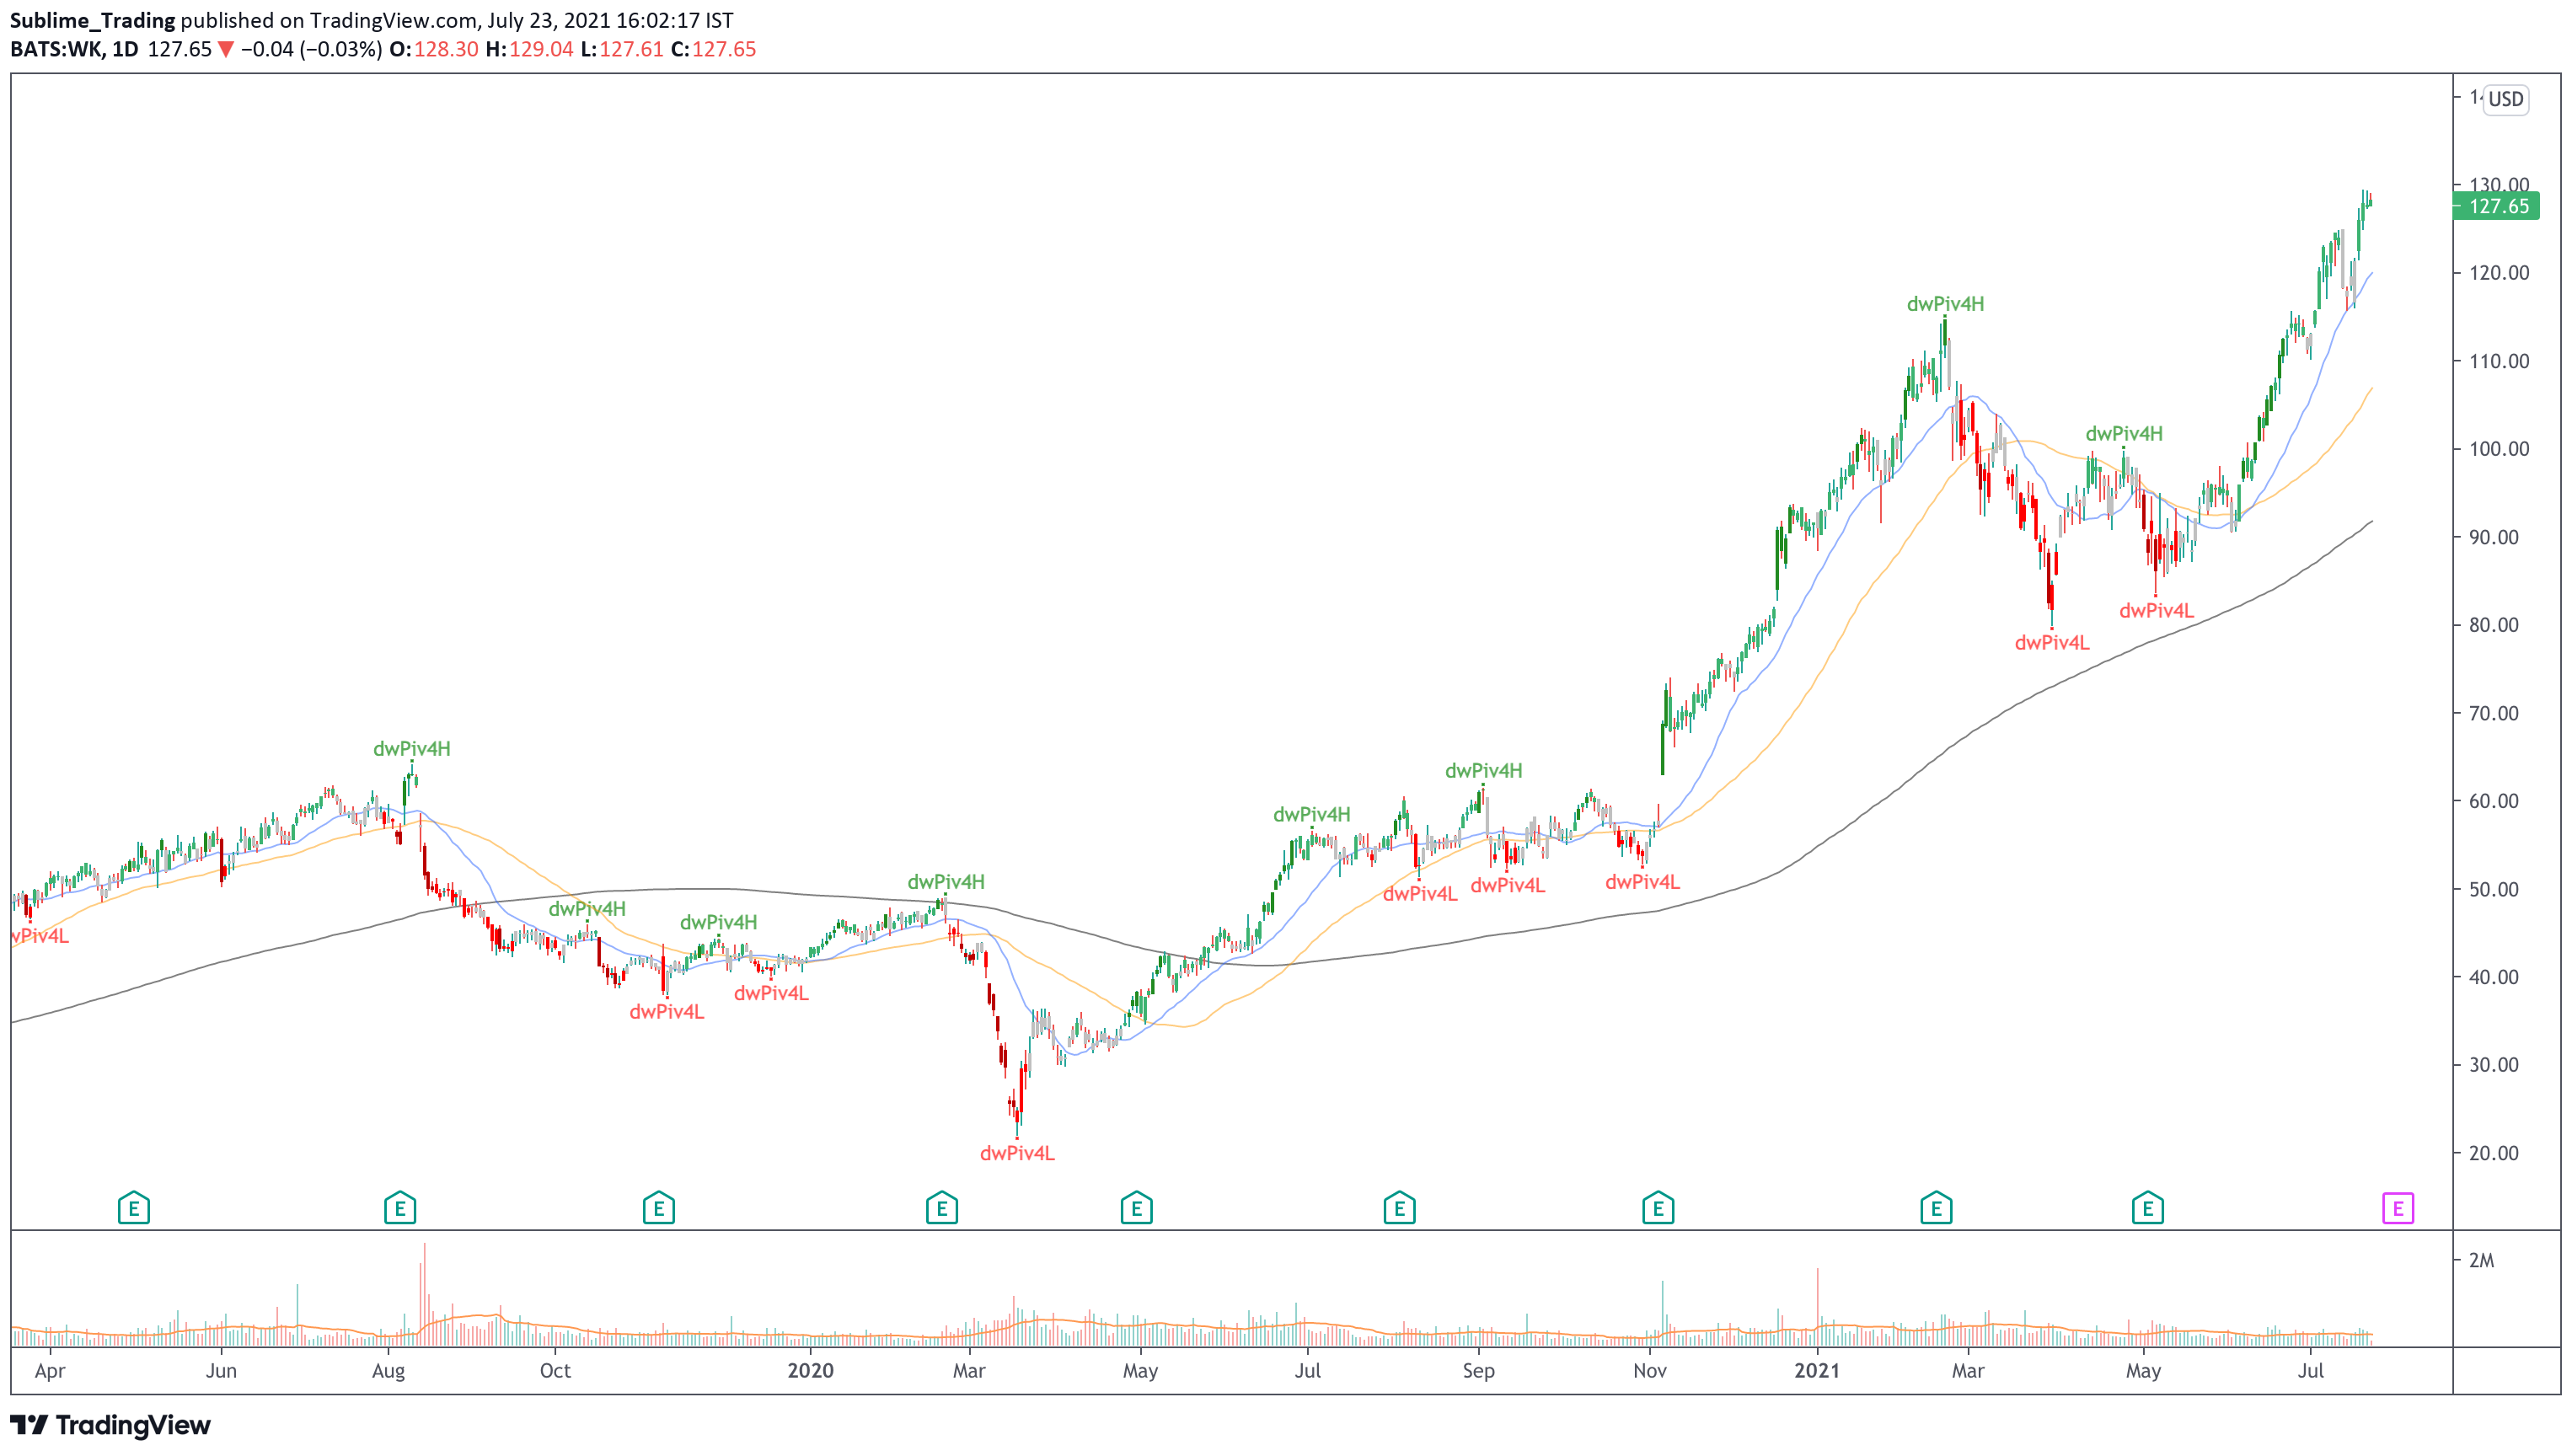
A stock with a mixed history of sustained trends and deep pullbacks. Following the impacts suffered as a result of the covid pandemic, price has shown strength, gaining over 300% since April 2020. In February 2021 price reached the major $100 round number, where price pulled back. However, price has since continued higher, with gains in June and July of 17% and 15% respectively.
On the weekly timeframe, price is trading above the 50sma, and the 200sma and the Sublime trend filter is green, confirming a bull trend in play.
On the daily timeframe below, price broke above the wPiv11 but followed up with a retest of this level, and has since bounced off the 20sma and continued higher. Price is above the 20sma, 50sma and 200sma and the Sublime trend filter is green. Patience is required as earnings are due on 3 August. We will update our Phoenix community if any high probability opportunities emerge following earnings.