PayPal Stock Analysis…(also a comparison to VISA)
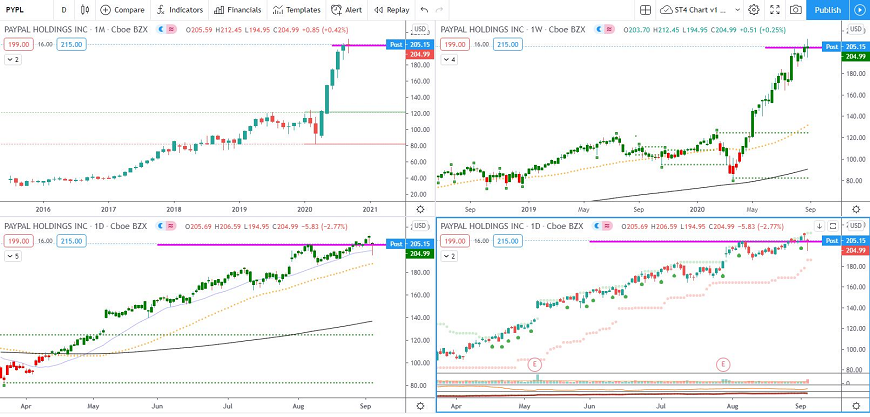
Running a quick analysis against PayPal, we can see that this stock is rising nicely.
It has reached its all-time high and has gone past the 200 mark.
Obviously todays drop will affect it a little, but then again, we would expect a pullback on this as its history shows us that it goes up, then catches its breath a little, then goes up and takes a quick breather again.
This is a stock that I am personally invested in as I do like this one. Obviously, this doesn’t mean that others should just because I am (please do your own homework)
The reason I am listing this is because I seem to be getting a few messages from people invested in the financial field and asking if they should cut their losses and sell or just hang on in there.
This is a personal decision and not one that I can make for you, but what I will say is that if one follows strong placed trending stocks, they may find that they are actually profiting a lot more than just hanging onto and hoping, with certain others.
Easier said than done.. How do you know if or when a stock will trend?
Good question and actually not the most difficult to answer. There are certain things that one must look out for, certain signals etc… If one understands these, they then stand a good chance of profiting from buying into the right stock.
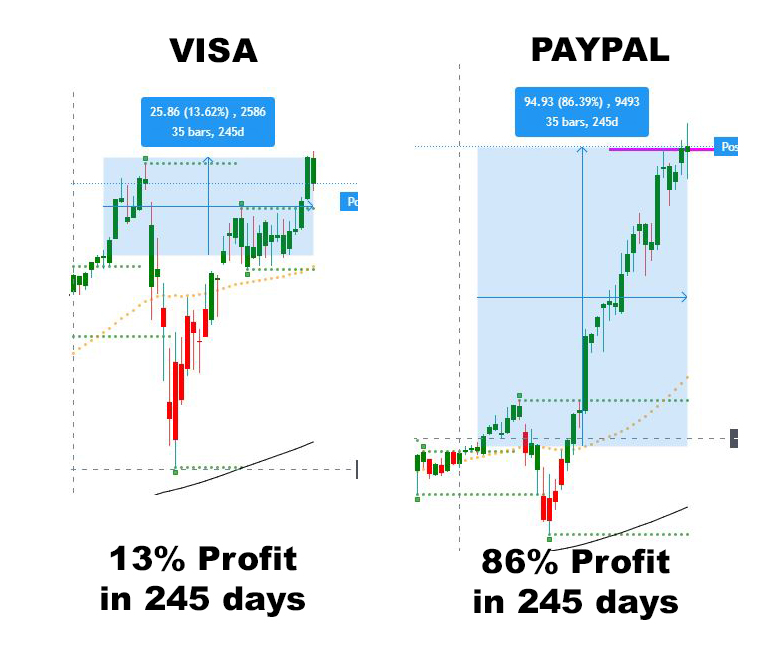
For example, if one had a choice from buying into PayPal or VISA at the beginning of the year, which one would you choose, and why? Both are great companies with good strong stock, both aren’t exactly going anywhere (I mean, as in collapsing) and though they took the Covid19 hit, both bounced back nicely..
You would have taken profit from both, so one may think that either is ok..(I have also put in a PayPal VISA comparison analysis chart to show difference)
The answer to this should have been PayPal. VISA had some points of resistance close by and had to deal with them before the stock could carry on and move forward.
PayPal also had some points of resistance, but they were a lot further away which meant that this stock had more room to run.
But, charts are EASY when you have PREVIOUS data. How does that help me now?
This is where Trend Trading Data Analysis comes in. If you understand how to do that, then you should start to see better gains on your investments…. (and yes, Trend Trading does include having calculated Stop Losses so that one doesn’t get their account burnt out by markets playing silly buggers with your money)
Not going to turn this into a session on how to Trend Trade stocks as that would be too long to start typing out, but happy to point people to free videos/tutorials if required..