• Home
  • Blog
  • Assets In Focus – The Hershey Company Return On Investment 211% and Republic Services Inc. Outperforming

Welcome to our weekly newsletter where we provide an overview of the main US and UK indices, along with analyses of selected stocks that are outperforming the market.

Let’s get into this week’s newsletter!

US & UK INDICES OVERVIEW

The S&P 500 closed the week at $4169, representing a 0.9% increase over the past week. In April, the S&P 500 has shown bullishness with a gain to date of 1.5%. In 2023, the S&P 500 has returned a gain of 8.5%. The all-time high for the S&P 500 is $4820, and the current price is 13.5% below this level. During 2022, the S&P 500 declined by 12.7%.

On the weekly time frame, the price continues to trade above both the 50 and 200 SMA. Our proprietary tool, the Sublime trend filter, remains green and the moving averages are aligned.

On the daily time frame, the Sublime trend filter is also green. The price is trading above the 20, 50 and 200 SMA and continues to use the 20 SMA as support. The price is making a series of higher highs and lower lows, indicating a bullish trend.

Despite concerns surrounding a potential recession, high inflation, and interest rates, the US indices have demonstrated notable resilience. As we continue to monitor these developments, we are proactively engaging with our Phoenix community to identify potential avenues for generating exceptional returns. We remain vigilant and remain committed to optimising our investment strategy.

This week the FTSE 100, the UK index, displayed modest weakness with a decline of 0.6%. Price remains above the weekly 50 and 200 SMA. Whilst on the daily time frame, price has retreated to the 20 SMA where it found support on Friday. Price remains above the 50 and 200 SMA and the moving averages are all aligned, indicating near-term bullishness.

PERFORMANCE REVIEW

The Hershey Company - HSY

The Hershey Company (HSY), a leading multinational chocolate manufacturer, has made a name for itself with its popular Hershey’s chocolate, which is enjoyed across the United States and in over 60 countries worldwide.

We first entered HSY in March and added a compound position several weeks later. We’ve written about this stock multiple times in this newsletter this year. Commencing in March, HSY has been bullish; on both the weekly and daily time frames the moving averages are aligned, and we anticipate compounding further as the trend continues. The next area of resistance is the $300 round number.

HSY’s total performance to date is a 211% Return On Investment and 10% Return On Capital, applying a full portfolio risk of 2%.

HSY is another excellent example of a trending stock in a volatile market. The total amount of time required to set up and manage this trade has been less than one hour over two monthsthis is the benefit of trend trading; using higher time frames such as monthly and weekly charts to avoid the noise and stress of shorter time frames. This approach enables busy professionals the freedom to pursue other interests and avoid hours each day in front of a trading screen.

OUTPERFORMING ASSET FOR THE WATCHLIST

Republic Services Inc. - RSG

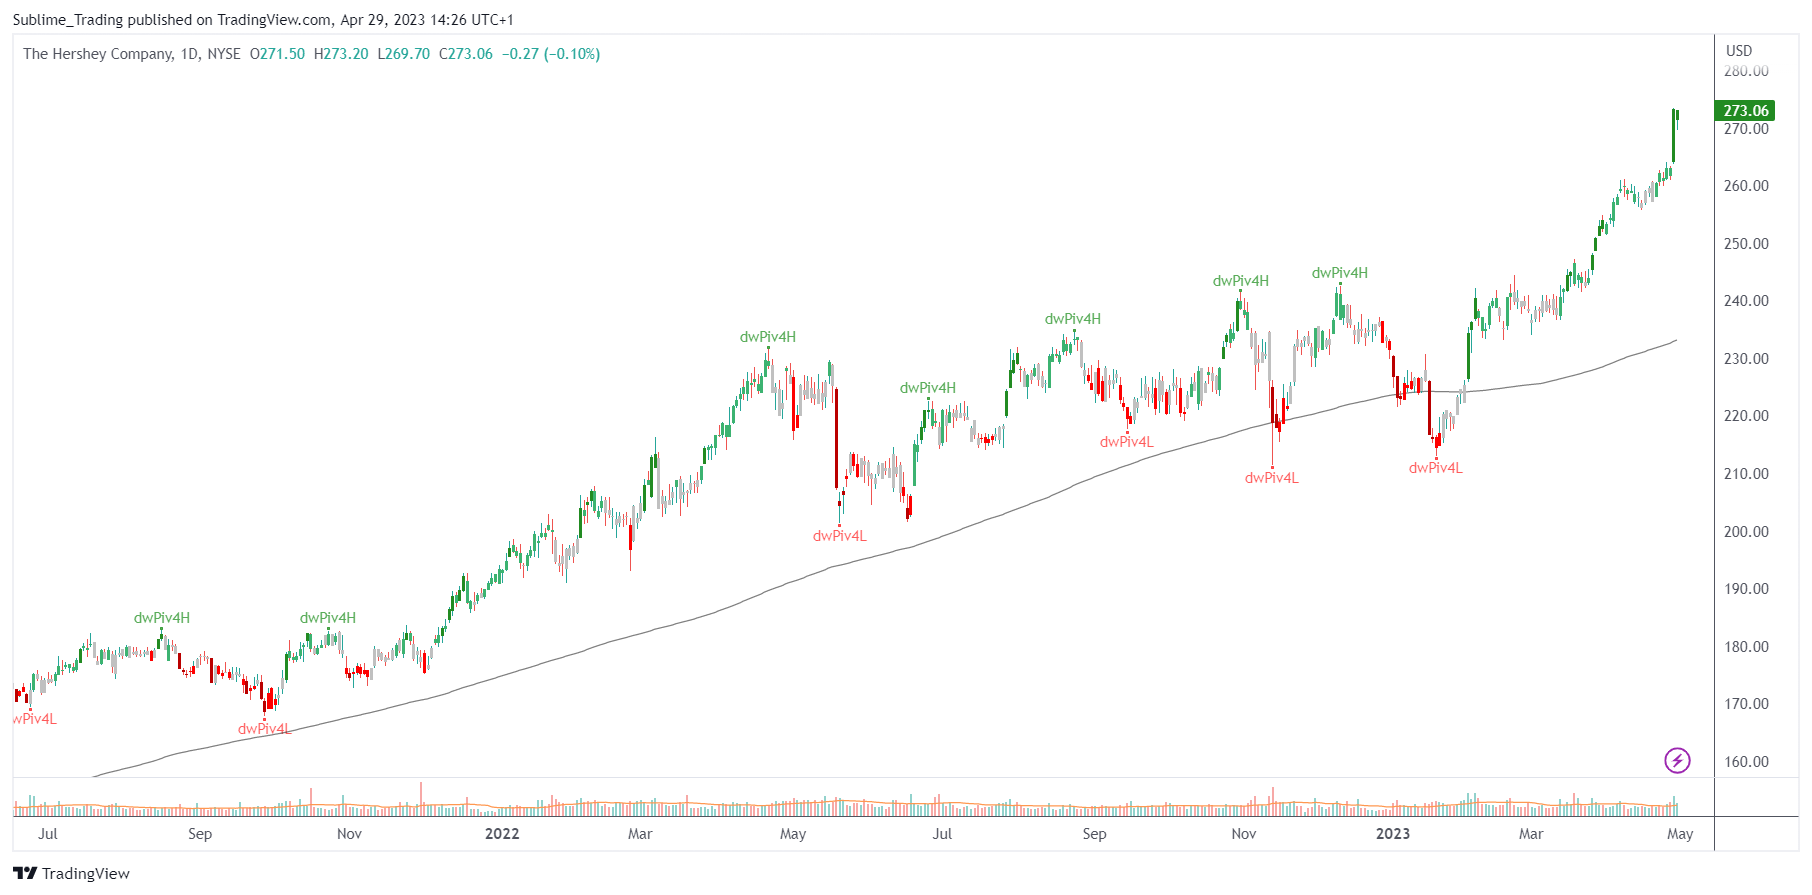
Republic Services, Inc. (RSG) is a provider of non-hazardous solid waste collection, transfer, disposal, recycling, and energy services. The company operates through collection operations, landfill operations, transfer station operations and recycling operations segments.

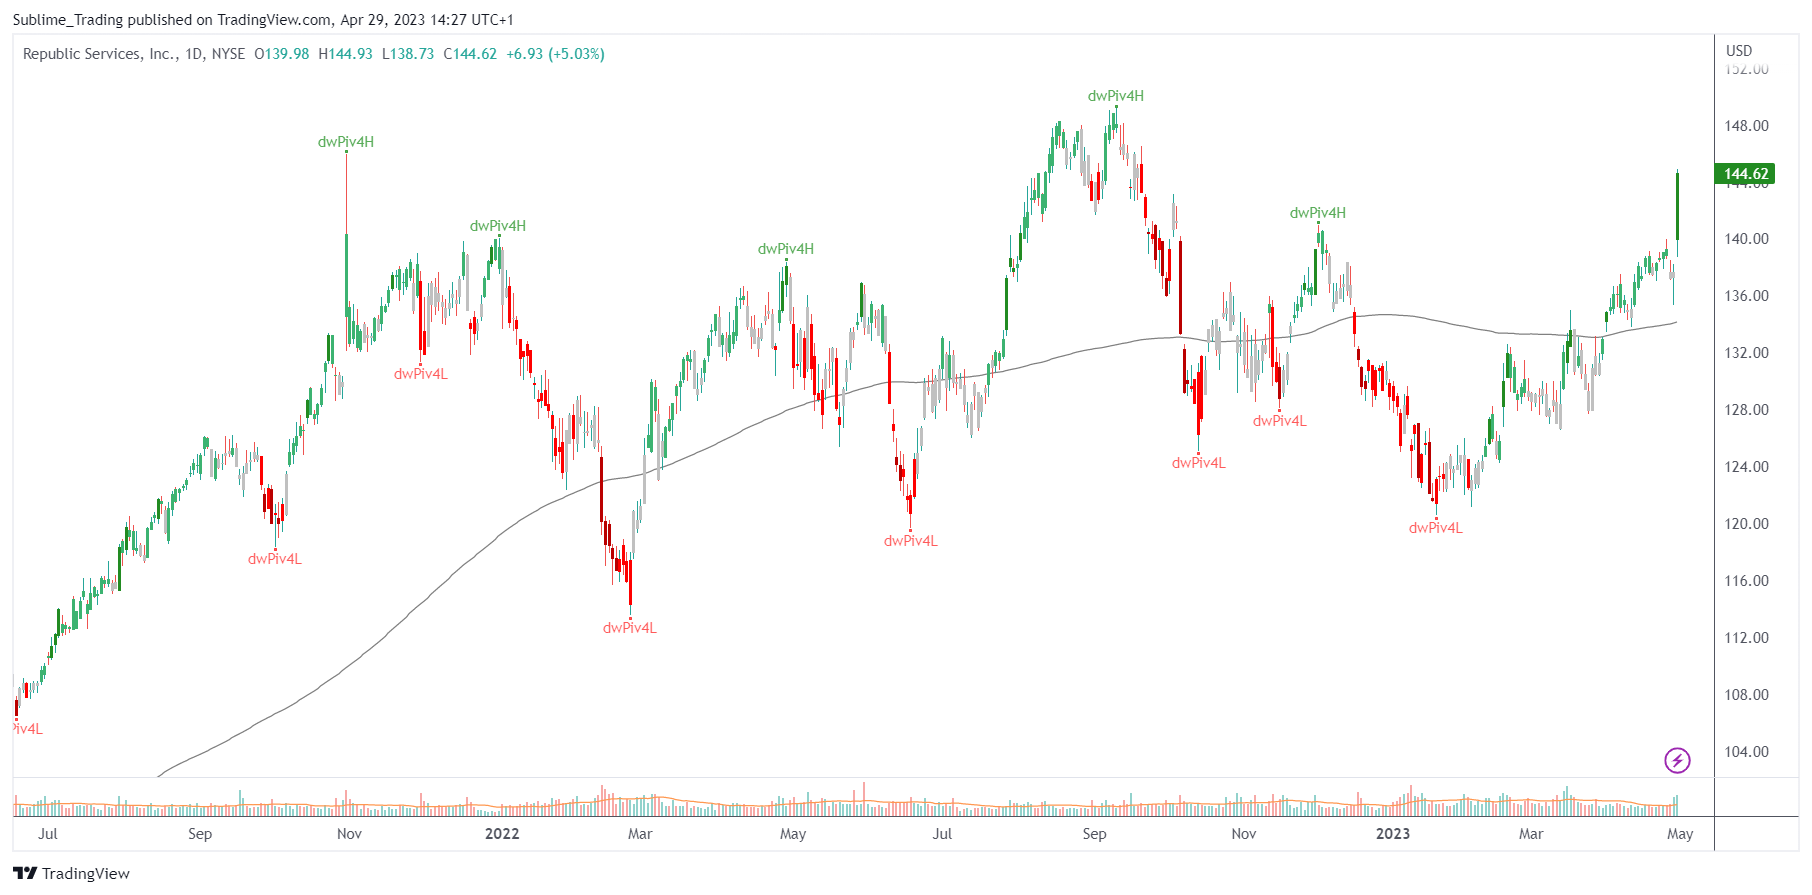
RSG has demonstrated a history of long-term trends, including between 2014 and 2020, as well as in 2021. Since October 2021, the price has been consolidating, but there are indications of bullishness. During the last trend cycle, following the breakout in April 2021, the price increased by over 40%.

RSG closed the week at $145, representing a 4.3% increase over the past week. In April, this stock has shown bullishness with a gain to date of 7.4%. In 2023, RSG has returned a gain of 12.4%. The all-time high for RSG is $148, and the current price is 2.0% below this level.

On the weekly time frame, the price continues to trade above both the 50 and 200 SMA. Our proprietary tool, the Sublime trend filter, remains green and the moving averages are aligned.

On the daily time frame, the Sublime trend filter is also green. The price is trading above the 20, 50 and 200 SMA and continues to use the zone between the 20 and 50 SMA as support. Since the 20 SMA crossed the 50 SMA, price has been making a series of higher highs and higher lows, indicating a bullish trend.

Looking ahead, the next area of resistance is at the $200 round number. A continuation pattern above the all-time high could present an opportunity for our Phoenix community members to invest in a strong trending stock.

Looking Ahead

This week, the US indices have once again demonstrated resilience by continuing their recovery from the US banking situation. With sustained strength in the leading US indices, the moving averages are aligned across all indices on the primary time frames, signalling potential opportunities for our Phoenix community of investors.

As we closely monitor market conditions, we are actively engaging with our Phoenix community to identify opportunities that offer exceptional returns. Despite ongoing volatility, we remain optimistic and steadfast in our pursuit of profitable trades.

Keep it simple. Keep it Sublime.

The ST Team

P.S. Answer 21 rapid-fire questions about your investing approach and then as if by magic, we will give you recommendations that are right for you and you’ll unlock your FREE Bonuses that will improve your investing results over the next 3 to 5 years.


Share 


You may also like

{"email":"Email address invalid","url":"Website address invalid","required":"Required field missing"}

Get in touch

Name*
Email*
Message
0 of 350
>