Welcome to our weekly newsletter where we provide an overview of the main US and UK indices, along with analyses of selected stocks that are outperforming the market.
Let’s get into this week’s newsletter!
US & UK INDICES OVERVIEW
S&P 500 Climbs Higher, Driven by the Technology Sector
Amidst ongoing media attention surrounding economic uncertainties and debt ceiling discussions, the S&P 500 has demonstrated remarkable resilience, defying expectations and climbing higher. This week the technology sector played a pivotal role in propelling the index to surpass the previous high achieved in January.
At Sublime Trading, our proven methodology revolves around a successful approach that prioritises factual evidence; market prices dictate our actions.
The S&P 500 concluded the week at $4205, marking a 0.5% increase over the previous week. Throughout the month of May, the S&P 500 has displayed a bullish trend, achieving a 0.9% gain thus far. Looking at the broader picture, the S&P 500 has been bullish with a 9.4% gain in 2023. Price continues to trade well below the all-time high of $4820, however the performance in 2023 is significantly improved on 2022 with the S&P incurred a decline of 12.7%.
From a weekly perspective, the price continues to remain above both the 50 and 200 Simple Moving Averages (SMA). Our proprietary tool, the Sublime trend filter, continues to signal a green status. Moreover, the alignment of the moving averages further reinforces the positive sentiment. Notably, this week’s closing price exceeded a crucial pivot level from January at $4195.
Shifting focus to the daily time frame, the Sublime trend filter also remains green, indicating a favourable outlook. The price remains above all moving averages, and their alignment further supports the positive momentum.
During the previous week, the FTSE 100, the prominent UK index, declined by 1.7%. Importantly, price remains above the 50 and 200 SMA on the weekly time frame. Whilst on the daily time frame, price is now trading below both the 20 and 50 SMAs but above the 200 SMA.
OUTPERFORMING ASSET FOR THE WATCHLIST
Nvidia Corporation - NVDA
NVDA: A Strong Breakout Following Earnings and New All-time High
Nvidia Corporation (ticker: NVDA) is an American multinational technology company. It is a software and fabless company which designs graphics processing units (GPUs), application programming interface (APIs) for data science and high-performance computing as well as system on a chip units (SoCs) for the mobile computing and automotive market. Nvidia is also a dominant supplier of artificial intelligence hardware and software. In a world increasingly reliant on technology, the chances are that the technology you are using is being powered by an NVDA GPU!
NVDA has established a track record of long-term trends, spanning various periods including 2016-2018, 2020-2021, and more recently since last October. These trends have resulted in significant price gains of 388%, 327%, and 252% respectively. Consequently, NVDA’s consistent performance in long-term trends instil confidence for long term investors, such as ourselves, in its future potential.
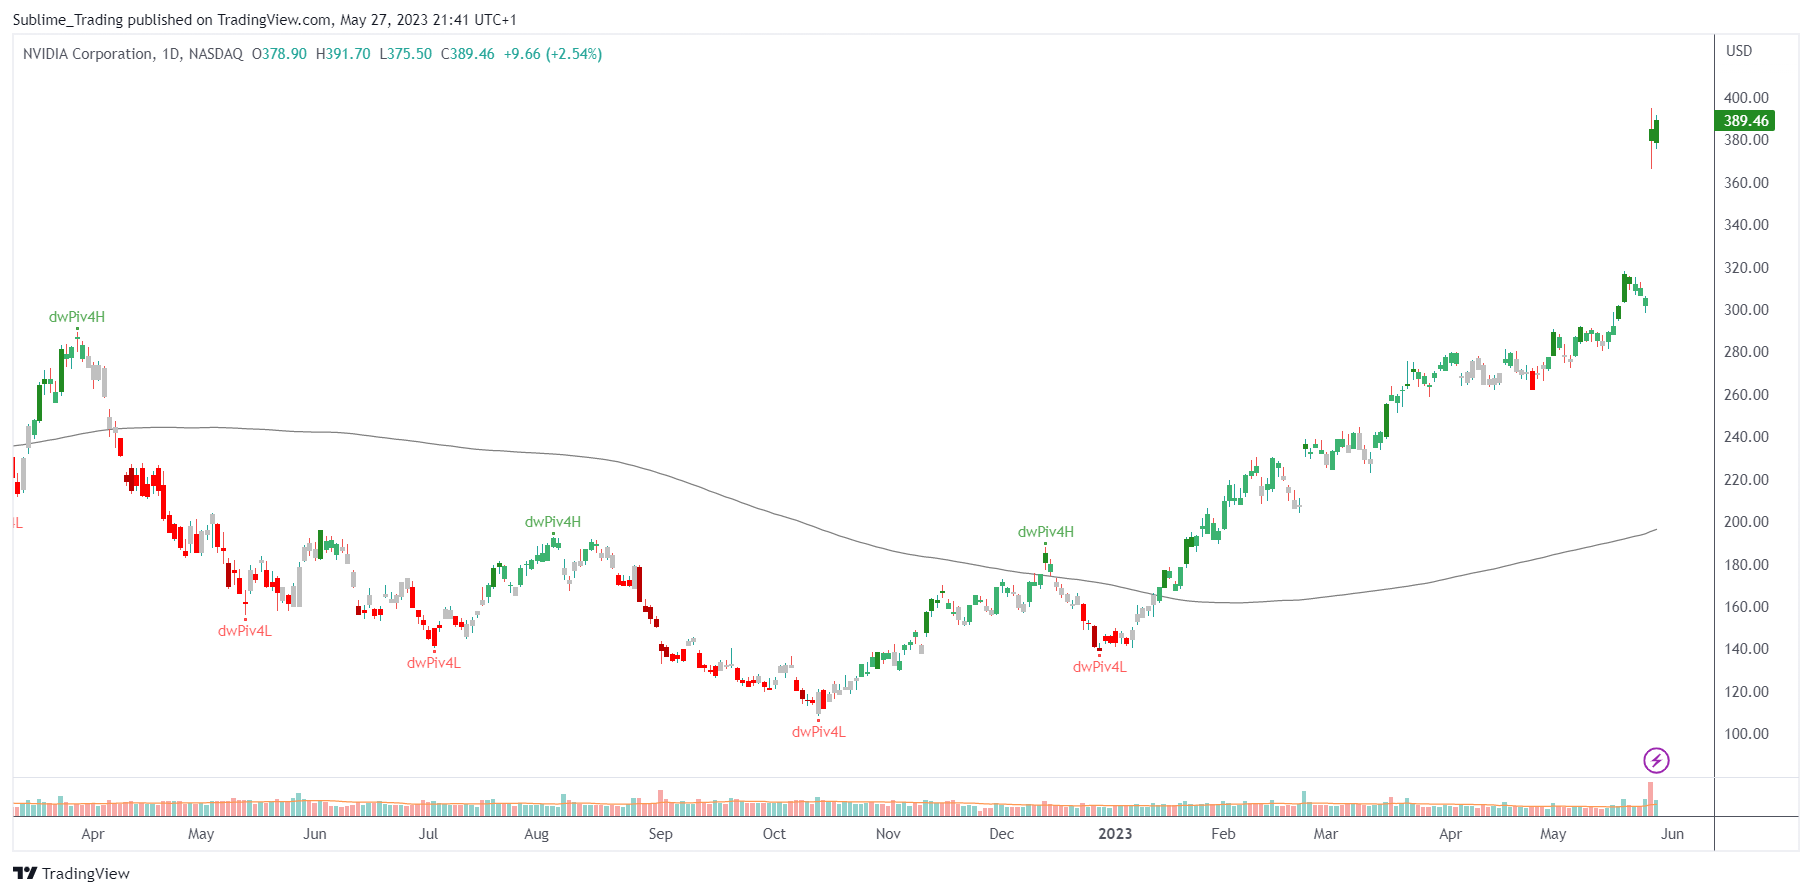
Closing the week at $389, NVDA exhibited a substantial gain of 24.3% over the past week. Throughout May, this stock has maintained a bullish trajectory, yielding an incredible gain of 40.4% thus far. NVDA has delivered an impressive return of 166.4% in 2023. The current price sits just 1.5% below its all-time high of $395.
On the weekly time frame, NVDA continues to trade above both the 50 and 200 SMAs. Our proprietary tool, the Sublime trend filter, remains consistently green, indicating positive market sentiment. Additionally, the alignment of moving averages further reinforces this optimistic outlook. Notably, in October 2022, the price retraced to the 200 SMA, subsequently gaining 47% since then.
Shifting focus to the daily time frame, the Sublime trend filter also reflects a green status, underscoring a favourable trend. The price remains above the 20, 50, and 200 SMAs. Moreover, the price continues to trend above the 20 SMA, while the moving averages exhibit alignment and divergence, suggesting near-term strength. Notably, this week’s earnings report triggered a a breakout response, driving a 24% gain.
Looking forward, the next significant resistance level to watch for is the $400 round number. Should the stock exhibit a continuation pattern above the all-time high, it could present an opportunity for our Phoenix community members, considering NVDA’s strong historical performance in long-term trends.
OUTPERFORMING ASSET FOR THE WATCHLIST
Quanta Services Inc. - PWR
PWR: Quanta Services Continues to Power Higher
Quanta Services (ticker: PWR) is an American corporation that provides infrastructure services for electric power, pipeline, industrial and communications industries. Capabilities include the planning, design, installation, program management, maintenance and repair of most types of network infrastructure. Quanta Services employs about 40,000 people. Its operating companies achieved combined revenues of about $11 billion in 2018. It is headquartered in Houston, Texas. In 1998, Quanta went public on the New York Stock Exchange and was added to the S&P 500 index in June 2009.
PWR has demonstrated a strong, bullish trend since July 2020, solidifying its position as a top-performing stock.
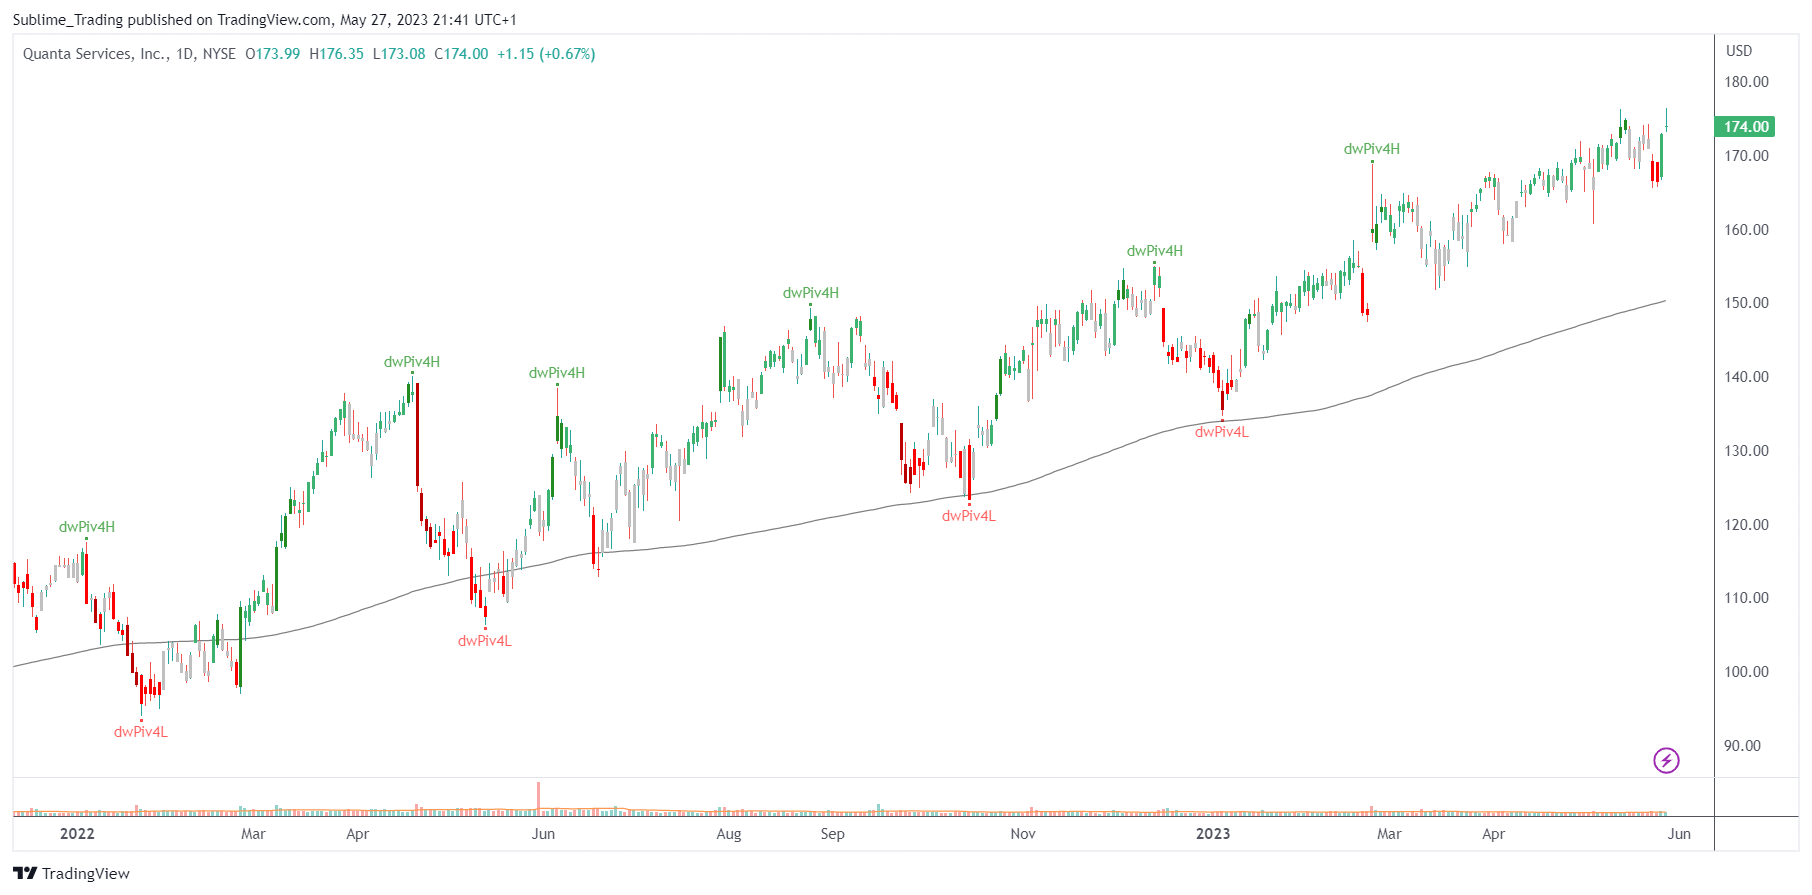
Closing the week at $174, PWR recorded a modest increase of 1.2% over the past week. Throughout May, the stock has maintained its bullish stance, delivering a gain of 2.4% thus far. Notably, in 2023, PWR generated a substantial return of 21.7%. The current price is just 1.1% below the stock’s all-time high of $176.
Examining the weekly time frame, PWR continues to trade above both the 50 and 200 SMAs. Our proprietary tool, the Sublime trend filter, is displaying a green status, highlighting the prevailing positive sentiment. Furthermore, the alignment of moving averages further supports the bullish outlook. Importantly, the price is utilising the key pivot level at $170 as a strong support level.
Shifting focus to the daily time frame, the Sublime trend filter also maintains its green status, reinforcing the favourable trend. PWR’s price remains above the 20, 50, and 200 SMAs. The stock is finding support within the zonal area created by the 20 SMA and 50 SMA, forming a series of higher highs and higher lows.
Looking ahead, the next significant resistance level to monitor is the round number of $200. Should this stock exhibit a continuation pattern above its all-time high, it could present a promising opportunity for our Phoenix community members, considering PWR’s robust bullish long-term trend.
Looking Ahead
Market Resilience Defies Downward Speculation
Amidst prevailing speculation surrounding a potential market downturn, the markets continue to exhibit resilience and continue to trend higher.
At Sublime, our unwavering commitment lies in conducting thorough analysis based on objective data and factual evidence presented in the charts. By adopting this approach, we aim to provide valuable guidance to our esteemed Phoenix community, collectively exploring opportunities that hold the potential for long-term, profitable trades.
Keep it simple. Keep it Sublime.
The ST Team
P.S. Answer 21 rapid-fire questions about your investing approach and then as if by magic, we will give you recommendations that are right for you and you’ll unlock your FREE Bonuses that will improve your investing results over the next 3 to 5 years.


