

MSFT: A Formidable Long-Term Trend and Impressive Performance
Microsoft needs little introduction. as the most prominent software seller dominating the PC market with its uber-popular Windows operating system and Office software packages. They also broke into gaming in 2001 with the Xbox and are not shy when it comes to acquiring websites such as Linkedin which they did for almost $27 billion in cash.
Since July 2016, MSFT has maintained a robust long-term trend, solidifying its status as a noteworthy stock. Over this period, the price has surged by an impressive 430%, illustrating the exceptional gains it has generated. For trend followers, MSFT undeniably stands as the king of stocks, exemplifying its remarkable market returns.
Closing the week at $318, MSFT exhibited a notable increase of 2.9% over the past week. Throughout May, the stock has demonstrated a bullish trend, with a current gain of 3.6% month-to-date. Moreover, in 2023 alone, MSFT has yielded an impressive return of 32.5%. It is important to note that the all-time high for MSFT stands at $350, and the current price remains 9.1% below that peak.
Analysing the weekly time frame, MSFT continues to trade above the 50 and 200 SMAs, indicating a positive market sentiment. Our proprietary tool, the Sublime trend filter, is green, reinforcing the bullish outlook. Additionally, the alignment of the moving averages further emphasises the prevailing strength. Notably, in October 2022, the price retraced to the 200 SMA before embarking on a subsequent gain of 47%.
Turning to the daily time frame, the Sublime trend filter remains green, affirming a favourable market environment. MSFT is also trading above the 20, 50, and 200 SMAs, underscoring its strong position. Furthermore, the moving averages are aligned and diverging, indicating near-term strength.
Looking ahead, the next notable level of resistance is the $400 round number. Should a continuation pattern emerge, it could present an opportunity for our Phoenix community members. MSFT, renowned for its strong history of long-term trends, holds the potential for capturing sustained growth.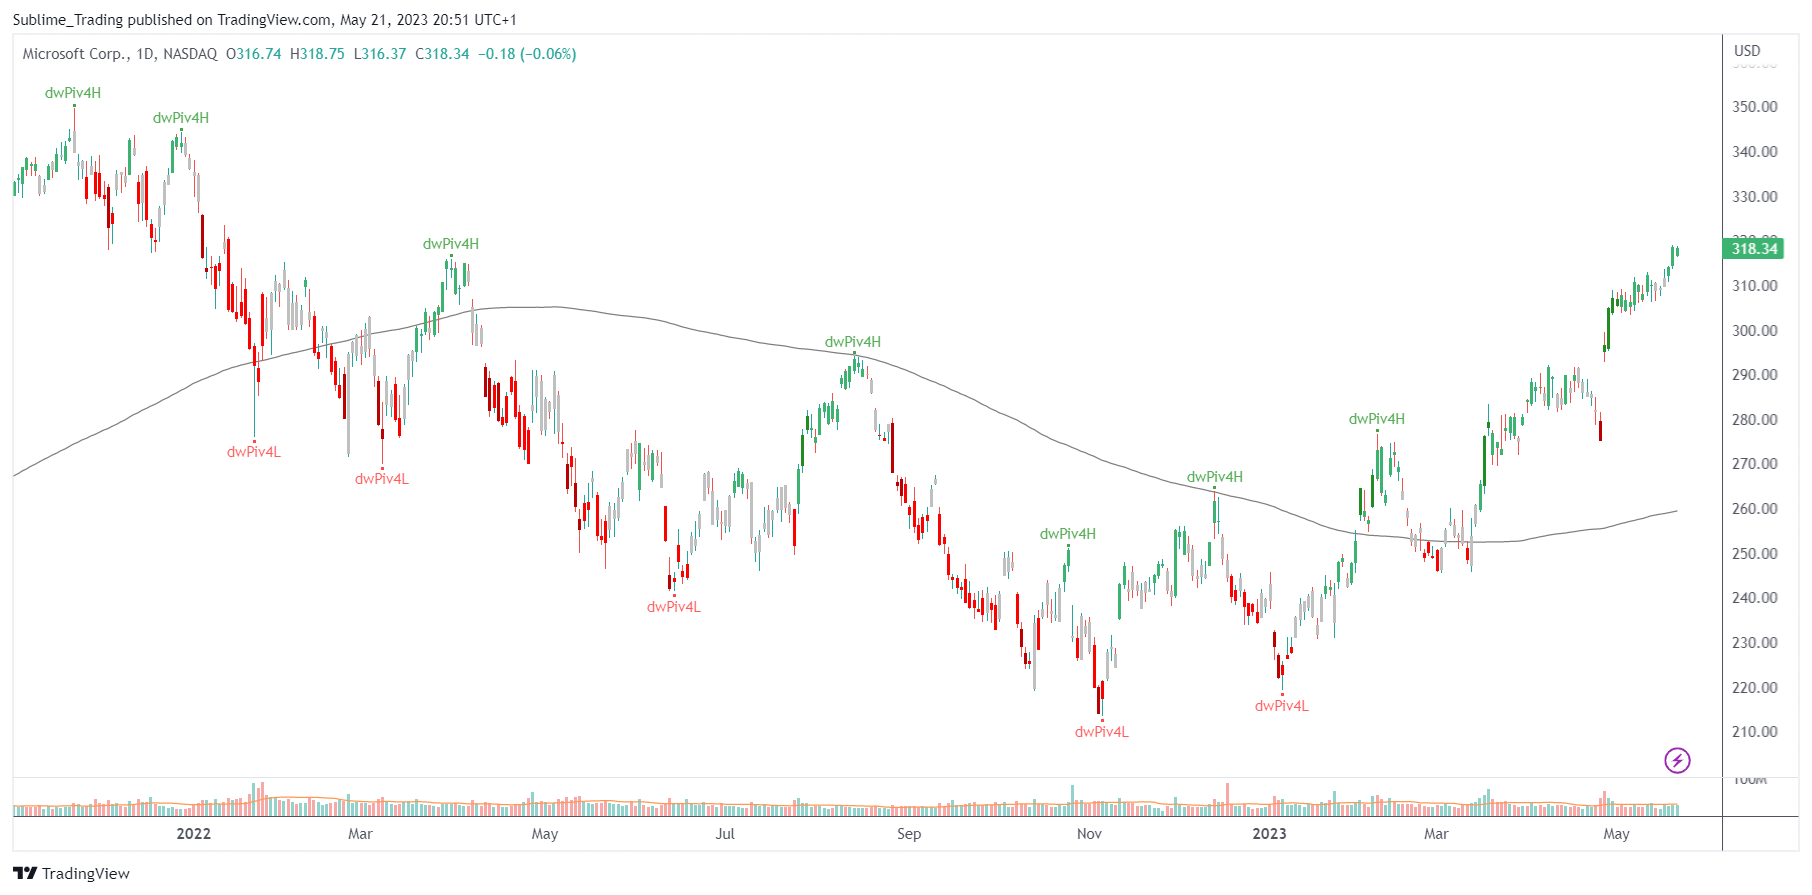
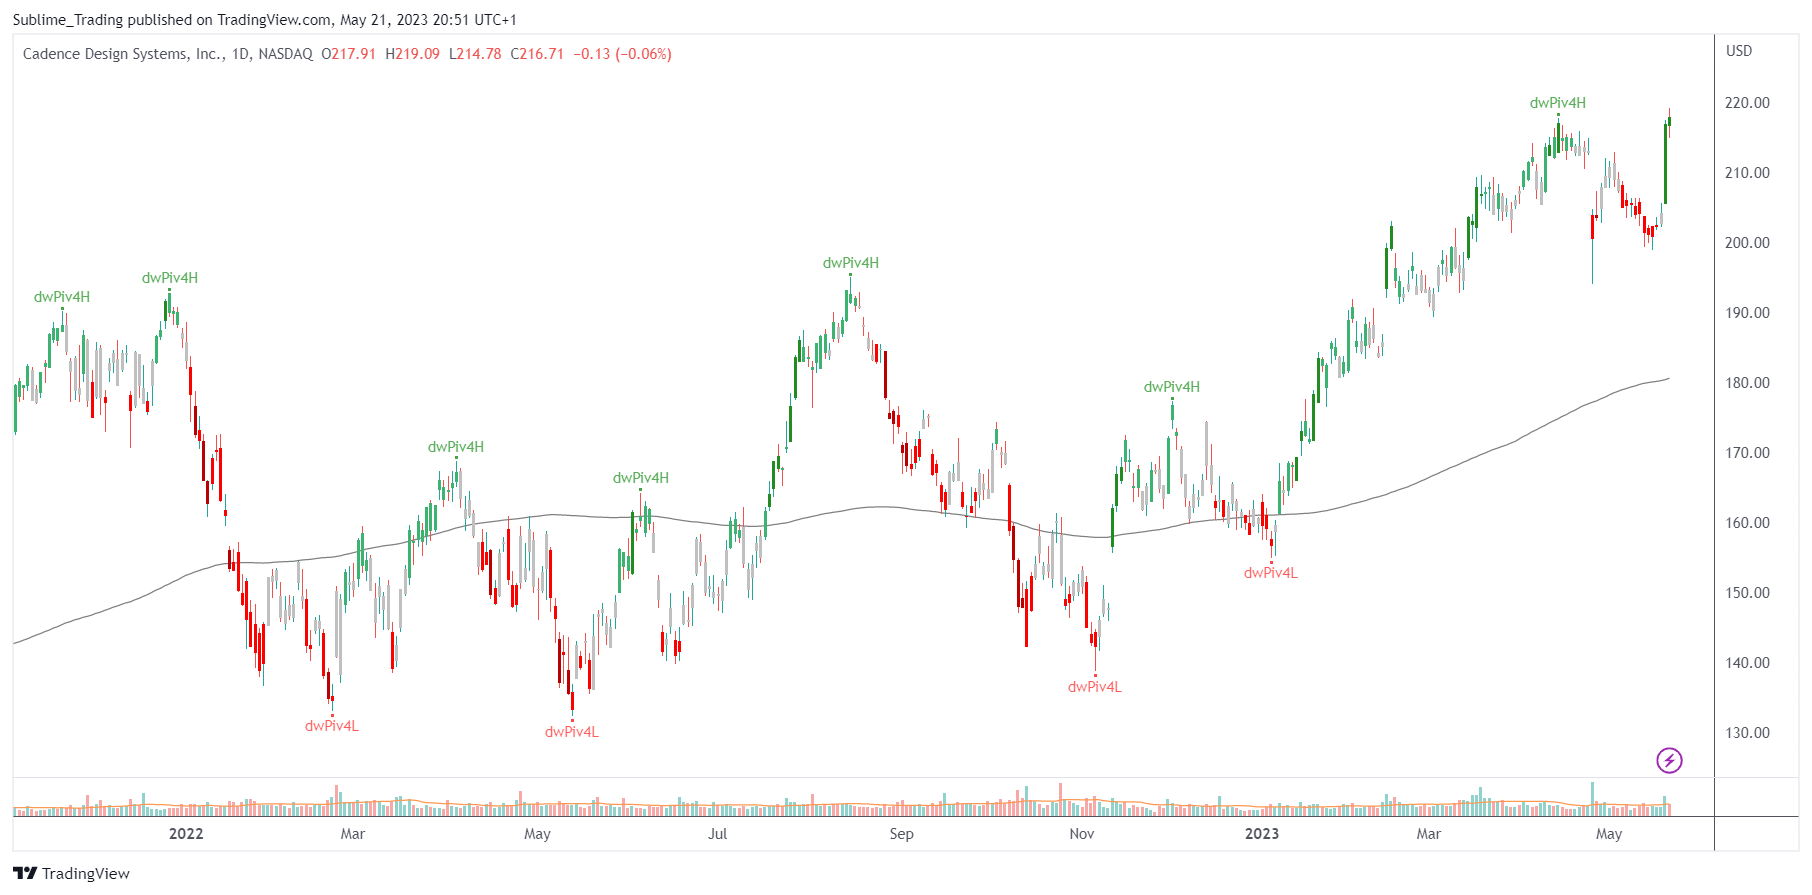
CDNS: A Prominent Long-Term Trend and Recent Breakout Indicate Bullish Momentum
Cadence Design Systems, Inc. is an American multinational computational software company, founded in 1988 by the merger of SDA Systems and ECAD, Inc. The company develops software, hardware and intellectual properties (IP) used to design chips, systems and printed circuit boards, as well as IP covering interfaces, memory, analogue, SoC peripherals, data plane processing units, and verification.
CDNS has demonstrated a consistent upward trajectory since 2012, making it an appealing stock for long-term investors. Between December 2021 and February 2023, the stock experienced a period of consolidation. However, in March, the stock broke out of this range and has since maintained a strong bullish momentum, culminating in reaching an all-time high this month.
Closing the week at $217, CDNS exhibited a noteworthy increase of 8.0% over the past week. Throughout May, this stock has exhibited a bullish trend, with a current gain of 3.8% year-to-date. Impressively, CDNS has yielded a remarkable return of 34.8% during 2023. It is worth noting that the current price is 0.9% below its all-time high of $219.
Examining the weekly time frame, CDNS continues to trade above the 50 and 200 SMAs, indicating positive market sentiment. Our proprietary tool, the Sublime trend filter, remains green, reinforcing the bullish outlook. Moreover, the alignment of the moving averages further supports this positive sentiment. Since bouncing off the 50 SMA in January, CDNS has exhibited bullishness.
Similarly, on the daily time frame, the Sublime trend filter remains green, suggesting a favourable market environment. Additionally, CDNS is trading above the 20, 50, and 200 SMAs. However, it is important to acknowledge that the 20 SMA is currently below the 50 SMA. Once the SMAs align, it will serve as a confirmation of a bullish trend.
Looking ahead, the next notable level of resistance lies at the $300 round number. Should a continuation pattern emerge, our Phoenix community members may find an opportunity in a stock that has yielded profitable trades in the past.