• Home
  • Blog
  • Assets In Focus – CHFJPY 6% Return, US Dollar Index (DXY) Outperforming

Welcome to another edition of our weekly newsletter where we provide an overview of the main US and UK indices, a specifically selected outperforming asset with deep analysis, and finally, an analysis of an asset we have in our portfolio, including a discussion on the returns the asset is generating for our Phoenix members.

Let’s get into this week’s newsletter!

US & UK INDICES OVERVIEW

This week the markets have continued the declines of the previous two weeks – the S&P 500 has declined by 7.9% in three weeks. On the monthly time frame, the S&P 500 continues to look weak, following August’s bearish candle. The index is now trading below the 4000 round number, after failing at this level along with the daily 50 SMA on Friday. The next major level of support is the low from last year at 3662, which, notably, acted as support in June. The bearish momentum has also continued in the Nasdaq 100 and Dow Jones indices. With the earnings season complete, we will await next week to ascertain if price can regain its recent upward movement or continue the bearish momentum from Friday. Our position remains unchanged; we continue to seek opportunities but remain vigilant.

This week the FTSE 100, the UK index, has had a muted month. On the weekly time frame price weakened this week to close below the 50 SMA. However, as mentioned last week, price remains in a range between the all-time high at 7687 and the weekly SMA, currently at 6945. On the daily time frame, the weakness in price this week has resulted in price moving below all moving averages – 20, 50 and 200 SMA. As with the US indices, we are actively looking for opportunities but remain vigilant.

OUTPERFORMING ASSET FOR THE WATCHLIST

US Dollar Basket - DXY

DXY is maintained, and published by ICE (Intercontinental Exchange, Inc.), with the name “U.S. Dollar Index” as a registered trademark. It represents the value of the United States dollar relative to a basket of foreign currencies, including the Euro (EUR), 57.6% weight, Japanese yen (JPY) 13.6% weight, Pound sterling (GBP), 11.9% weight, Canadian dollar (CAD), 9.1% weight, Swedish krona (SEK), 4.2% weight and Swiss franc (CHF) 3.6% weight. The Index goes up when the U.S. dollar gains “strength” (value) when compared to other currencies.

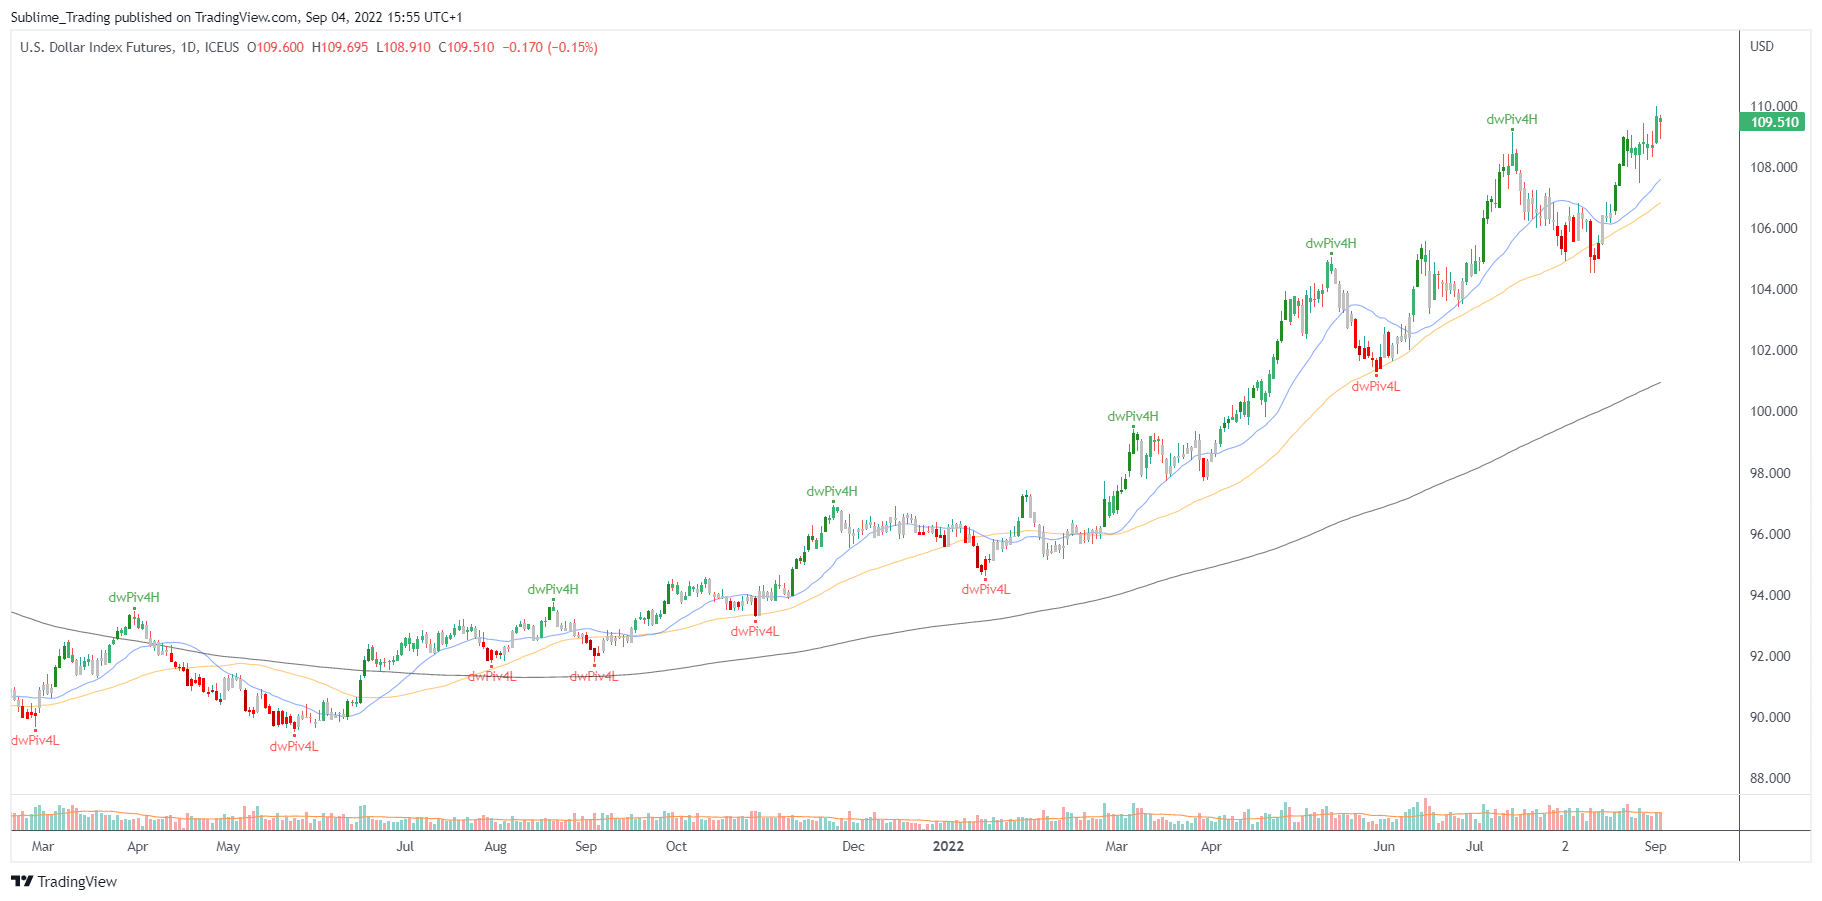
DXY has a history of long-term trends, both bullish and bearish, which positions it as an attractive asset to trade. On the monthly time frame, since price broke above last year’s high at 96.88, price has gained 12.8%. Price was particularly bullish in August 2.6%. Price created an all-time high this month at 109.71. 

On the weekly time frame, price is trading above the 50 and 200 SMA, and the Sublime trend filter is green. Price is moving higher, but interestingly volume is decreasing. Whilst on the daily time frame below, price is trading above the 20, 50 and 200 SMA, and the Sublime trend filter is also green.

Looking ahead, a continuation pattern above the current all-time high could offer our Phoenix community members an opportunity in USD-linked assets – we currently hold positions in USDJPY.

PERFORMANCE REVIEW

CHFJPY

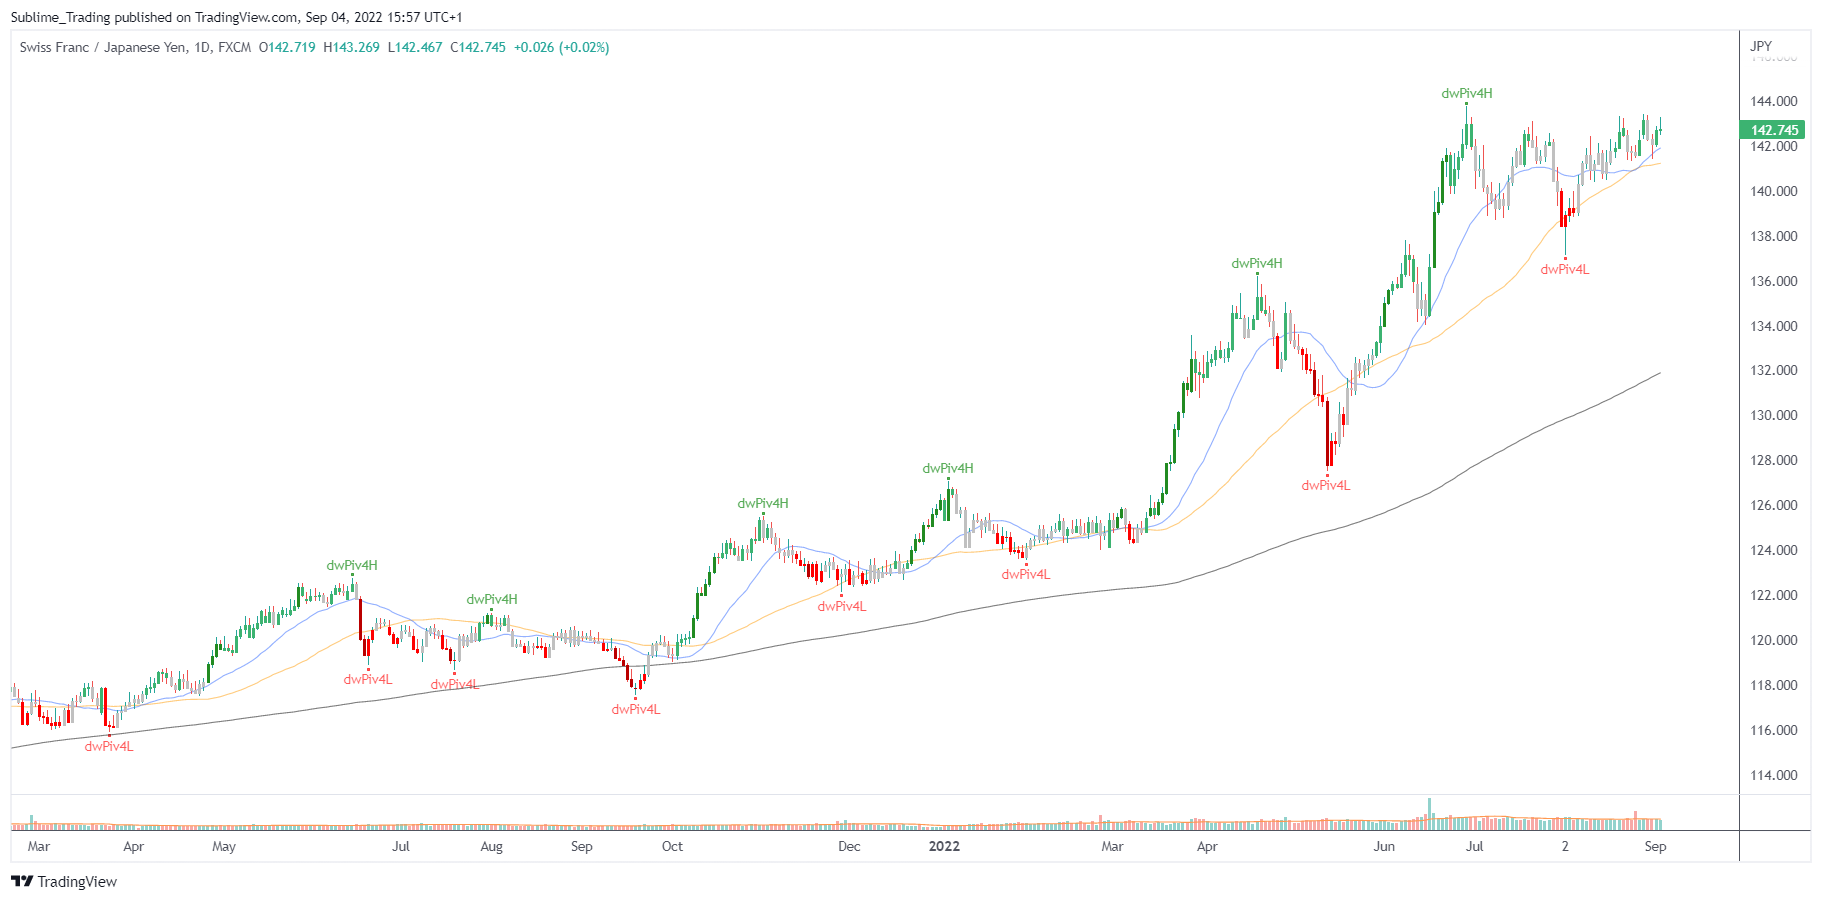
We last wrote about CHFJPY in our newsletter on 6th August. CHFJPY is an asset with a history of trends. Trading forex assets can be complex, but with the proper knowledge and support, such as that which our Phoenix community receive, profitable investing in forex assets is achievable.

We first entered CHFJPY in October 2021 and have since compounded. We monitored the asset through the pullback in May which has proven to be the correct approach. This asset made a higher high and higher low between 8th – 15th June, and since 29th June the asset has been in a range with the zonal area around 143.00 acting as strong resistance. We will monitor this position and wait to see if this resistance level can be broken, followed by a continuation pattern. The return to date on total portfolio value exceeds 6% using a risk of just 2%, a return on risk of over 300%.

The total amount of time required to set up and manage this trade has been less than two hours over ten months – this is the benefit of trend trading; using higher time frames such as monthly and weekly charts avoids the noise and stress of shorter time frames. This approach enables busy professionals the freedom to pursue other interests and avoid hours each day in front of a trading screen.

Looking Ahead

This week the US and UK indices have continued lower following the break in the bullishness seen in July and early August. However, price never moves in a straight line. We now need to assess whether Friday’s move will be sustained, resulting in further weakness. We continue to actively monitor all markets, scanning for opportunities such as the stocks described today, along with the JPY forex pairs and Dollar strength, and sharing these with our Phoenix community for excellent returns.

Answer 21 rapid-fire questions about your investing approach and then as if by magic, we will give you recommendations that are right for you and you’ll unlock your FREE Bonuses that will improve your investing results over the next 3 to 5 years.). 

Keep it simple. Keep it Sublime.

The ST Team


Share 


You may also like

{"email":"Email address invalid","url":"Website address invalid","required":"Required field missing"}

Get in touch

Name*
Email*
Message
0 of 350
>