A quick scan of Rolls Royce and what is happening with their stocks – A Quick Summary!
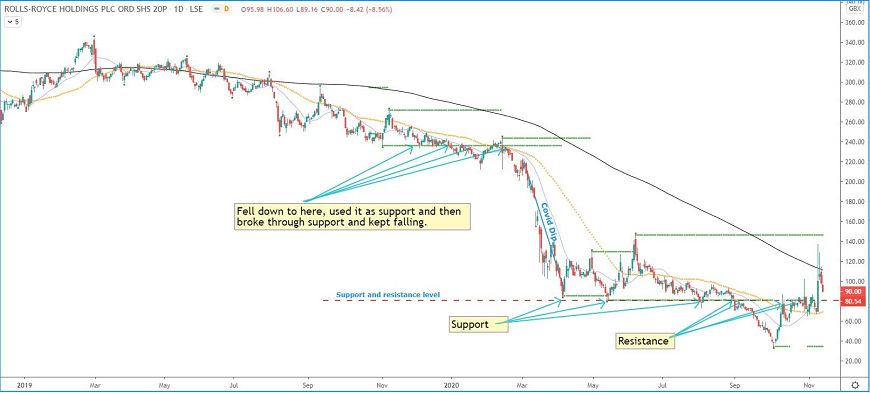
We can see that from around Nov 2019, they were using the 238 area as support, then cut below support around mid-Jan 2020.
Mid Feb, they then tested the same support area and bounced off it, so it suddenly became an area of resistance for them.
Towards March 2020, the Covid19 dip hit them hard and they went into a freefall and fell to about 80.
They did sink to around 38 but managed to pull out of that and are now again using the 80 areas as either support or resistance.
As we can see, in early Nov, they did try to pull up towards the 138 mark but are again being pulled back towards the current support/resistance level.
We all know the news about Rolls Royce, they make engines for aviation and they get their main money from servicing these.
Speaking to a colleague today, he mentioned that they may also have the contracts to build lots of mini nuclear reactors and this should see them right.. (I believe I mentioned this many months ago also in an article I wrote and placed on here).
The guy that mentioned this to me is also a trader, though trading Fundamentals, and I mentioned that what he said may be true, but it isn’t showing through in the charts as yet, so it is just that, news.
Nobody can say where this share will fall to, or even how high it will go, but what we can see is patterns forming.
What’s In A Pattern?
Patterns aren’t just pretty little squiggles on a chart, patterns are actually signs of user behaviour and show how traders feel about certain stocks. They give us an insight into what Big Money is doing, not just big money but also millions of traders worldwide, as everything they do, is shown within the charts.
I and other trend traders I work alongside, use a 4 chart system that gives us a lot of information on any chosen stock and puts us in a better place to make a decision on said stock.
Yes, there is more to it than just the charts, as we dive into more information to analyse our stocks, but it does rule out all the noise, i.e. – hype, possible news, professional trader comments, etc, as we can actually get all the info we need to trade this stock, directly from a 4 part charting system
So, maybe they have, or will get the contract to build multiple mini reactors, but this isn’t coming through in the charts as yet, and until then (plus, in this case, a few other variables), we stand aside…
Please Read More